SCO Civilisational Dialogue Forum

SCO

SCO Latest News

  • The first Shanghai Cooperation Organisation (SCO) Civilisational Dialogue Forum (CDF) was inaugurated by the Indian PM at the historic Purana Qila in New Delhi. 
  • The three-day event, proposed by India at the SCO Summit in Tianjin, China, in 2025, brought together culture ministers and delegates from over 20 countries.
  • Held amid growing geopolitical tensions and global conflicts, the forum seeks to strengthen regional cooperation through shared civilisational heritage, cultural exchanges and mutual understanding.

Cultural Diplomacy

  • Cultural presentation by the Sangeet Natak Akademi: 
    • Showcased -
      • India's 5,000-year-old Vedic heritage and civilisational continuity.
      • Buddhism's origin in India and its spread across Asia and Central Asia.
      • India's cultural diversity, including traditions from Kashmir to Arunachal Pradesh.
      • The Silk Route as a channel for the exchange of trade, literature, knowledge and culture, etc.
    • Sufi music, Gurbani, Qawwali and other traditions highlighted India's pluralistic ethos and peaceful coexistence.
  • Geopolitical significance:
    • The presentation subtly reinforced India's cultural and historical connections with regions and territories.
    • Buddhist heritage and traditions of Northeast India were highlighted in the presence of Chinese delegates, while Kashmiri cultural performances were showcased before the Pakistani delegation.
    • It projected India's civilisational influence and cultural diversity as instruments of soft power.

PM’s Vision

  • Addressing the forum, the Indian PM emphasised that cultural connections are among the strongest guarantees of global peace.
  • Key arguments:
    • Cultural cooperation can complement the SCO's existing collaboration in security, economy and connectivity.
    • Civilisations flourish through dialogue, mutual enrichment and exchange rather than isolation.
    • India's philosophy of Vasudhaiva Kutumbakam (the world is one family) underlines the importance of collective welfare and global harmony.
  • The PM envisioned the forum as more than a ceremonial platform, suggesting that it could become a platform to guide global thinking towards peace and cooperation.

Major Proposals for Cultural Cooperation

  • Digital preservation of heritage:
    • Digitisation of ancient manuscripts, historical documents and artefacts preserved to make cultural heritage accessible to younger generations.
    • India's digitisation efforts: The National Archives has undertaken a major digitisation initiative targeting approximately 300 million pages, with nearly two-thirds digitised (by July 2026).
  • AI-enabled translation and research:
    • Leveraging Artificial Intelligence (AI) to accelerate the translation of ancient literary and historical works.
    • Promoting joint research projects to uncover previously unexplored dimensions of shared history.
    • Encouraging academic collaboration among universities and research institutions.
  • Cultural exchanges:
    • Organising joint exhibitions through museums and cultural institutions.
    • Promoting exchanges among scholars, researchers and artists.
    • Conducting joint cultural festivals to familiarise people with diverse traditions.
  • Heritage tourism and cultural routes:
    • Developing transnational heritage circuits connecting historical sites associated with the Silk Route and Buddhist heritage.
    • Promoting cultural tourism as a source of P2P connectivity and economic opportunities.

India’s Civilisational Heritage and SCO Cooperation

  • The exhibition 'Astitva – The Essence of Our Existence' showcased India's archaeological and cultural heritage at Purana Qila.
  • The historic venue, associated by some scholars with the Mahabharata-era Indraprastha, reinforced India's ancient cultural legacy.
  • The Union Culture Minister highlighted that heritage is not merely a remembrance of the past but a living resource for knowledge, livelihoods, creativity and national confidence.

Diplomatic Significance

  • The forum witnessed participation from SCO members and other regional countries, including China, Russia, Pakistan, Iran, Belarus, Uzbekistan and Tajikistan.
  • Pakistan's Climate Change Minister attended the inauguration, marking the first visit by a Pakistani minister to India since Bilawal Bhutto's visit in 2023.
  • His visit took place amid strained India-Pakistan relations following the Pahalgam terror attack and Operation Sindoor in April–May 2025.
  • Hence, the forum provided an opportunity to maintain limited diplomatic engagement and encourage regional dialogue.

Significance for India and the SCO

  • Soft power diplomacy: Strengthens India's international influence through Buddhism, yoga, cultural traditions and civilisational heritage. 
  • Regional connectivity: Revives historical linkages through Silk Route and Buddhist heritage circuits.
  • Knowledge diplomacy: Promotes cooperation in AI, digitisation, historical research and preservation of cultural resources.
  • Global governance: Positions cultural dialogue as a complementary instrument for addressing conflict, mistrust and geopolitical fragmentation.

Way Forward

  • Institutionalise the forum through regular meetings, joint cultural programmes and collaborative research.
  • Establish common digital platforms for preserving and sharing manuscripts and historical archives.
  • Ensure that cultural heritage is used for cooperation rather than competing historical claims.
  • Strengthen cultural tourism while protecting heritage sites and respecting local communities.
  • Translate civilisational dialogue into practical cooperation without overlooking existing security and political challenges.

Conclusion

  • The SCO Civilisational Dialogue Forum reflects India's attempt to complement traditional geopolitics with cultural diplomacy. 
  • By this, India can strengthen its soft power and contribute to a more peaceful and cooperative Eurasian region.

Source: IE | IE

SCO FAQs

Q1: How can cultural diplomacy strengthen India's soft power?

Ans: By promoting India's civilisational heritage, Buddhism, yoga, art and pluralistic traditions.

Q2: Why is the SCO Civilisational Dialogue Forum significant for regional cooperation?

Ans: It complements security and economic cooperation by promoting shared heritage, cultural exchanges, etc.

Q3: What is the role of AI in preserving and promoting cultural heritage?

Ans: AI can accelerate manuscript translation, digitise historical archives, facilitate collaborative research, etc.

Q4: How can the historical Silk Route contribute to contemporary regional connectivity?

Ans: Developing transnational heritage circuits along the Silk Route can promote P2P exchanges and regional integration.

Q5: How can civilisational dialogue complement traditional diplomacy in resolving geopolitical differences?

Ans: Cultural dialogue creates mutual understanding and trust beyond political disagreements.

Gold Prices in 2026 – Reasons for the Fall and Future Outlook

Gold Prices in 2026

Gold Prices in 2026 Latest News

  • Gold prices in the Delhi market declined by approximately 25% between February 28 and November 20, 2026, prompting concerns among investors and prospective buyers about the reasons behind the correction and the possibility of further declines.

Recent Trend in Gold Prices

  • Gold prices in India have witnessed a sharp correction in 2026 after an exceptional rise over the preceding four years.
  • According to Google Finance data, the price of 24-carat gold in Delhi declined from Rs. 1,70,305 per 10 grams on February 28, 2026, to Rs. 1,26,875 on November 20, 2026.
  • However, the decline needs to be viewed against the preceding rally:
    • February 26, 2022: Rs. 51,715 per 10 grams.
    • February 24, 2024: Rs. 64,185 per 10 grams.
    • February 28, 2026: Rs. 1,70,305 per 10 grams.
    • November 20, 2026: Rs. 1,26,875 per 10 grams.
  • Gold prices had increased by approximately 165% in the two years preceding February 2026 and 230% over four years. 
  • Even after the recent correction, prices remained approximately 145% higher than in February 2022 and 98% higher than in February 2024.
  • This indicates that the 2026 decline represents a correction following an extraordinary price rally rather than a complete reversal of the earlier gains.

Major Sources of Global Gold Demand

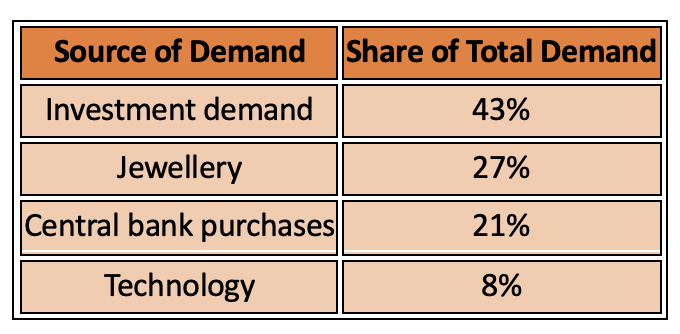
  • According to the World Gold Council, global net annual demand for gold averages approximately 3,200 tonnes, driven by four major sources:

Major Sources of Demand in Gold

  • Gold is distinct from conventional financial investments because it does not generate regular income through interest or dividends. 
  • Its primary investment value lies in its ability to act as a store of value and protect purchasing power during periods of inflation and economic uncertainty.
  • For instance, inflation reduces the purchasing power of money over time. Gold has historically helped investors preserve value because its price has generally risen during periods of sustained inflation and uncertainty.
  • World Gold Council data since 1971 indicates that gold prices have outperformed both US and global consumer price indices over the long term.

Reasons for Fall in Gold Prices in 2026

  • Higher Interest Rates Reduce Gold's Attractiveness
    • Gold does not generate interest or regular income. Consequently, when interest rates rise, investors have greater incentives to shift towards interest-bearing financial instruments such as government bonds.
    • This creates an inverse relationship between interest rates and the attractiveness of gold as an investment.
    • Higher interest rates can therefore reduce investment demand for gold and put downward pressure on its prices.
  • Changing Inflation Expectations
    • Gold is traditionally considered a hedge against inflation. When investors expect inflation to remain elevated, demand for gold generally increases as they seek to protect their purchasing power.
    • However, expectations of tighter monetary policy and higher interest rates have strengthened the belief that inflation could be brought under control.
    • This change in inflation expectations has further weakened demand for gold.
    • The trend is not limited to the US Federal Reserve. Other major central banks, including the Bank of Japan and the European Central Bank, have also moved towards higher interest rates.

Factors That Drove the Earlier Gold Price Rally

  • The sharp rise in gold prices before February 2026 was supported by four major factors.
  • Rising Government Borrowing: Heavy borrowing by governments of major economies increased concerns about fiscal sustainability and future inflation. These concerns strengthened gold's appeal as a store of value.
  • Persistent Inflation: Both headline inflation and core inflation remained above target levels in several major economies. Core inflation excludes the effects of volatile food and fuel prices, helping assess underlying price pressures.
  • Geopolitical Uncertainty: Wars, international tensions and geopolitical instability increased demand for gold as a safe-haven asset. During periods of uncertainty, investors often shift towards gold to protect their wealth.
  • Central Bank Purchases: Central banks have remained net buyers of gold since the 2008 global financial crisis. Their purchases have provided sustained support to global gold demand and prices.

Future Outlook for Gold Prices

  • The future direction of gold prices will depend on the interaction between monetary policy and the broader economic and geopolitical environment.
  • Rising interest rates are likely to exert downward pressure on gold prices by increasing the attractiveness of alternative investments. However, several factors could continue supporting gold demand:
    • Government borrowing: Continued high levels of public debt and borrowing could sustain concerns about inflation and financial stability.
    • Geopolitical uncertainty: International conflicts and geopolitical tensions may continue to support safe-haven demand.
    • Central bank purchases: Central banks may resume or increase gold purchases as prices moderate, maintaining a source of structural demand.
    • Inflation trends: Any renewed increase in inflation could strengthen gold's appeal as a hedge against declining purchasing power.
  • Therefore, the possibility of further price declines cannot be ruled out. However, the continuation of central bank purchases, geopolitical uncertainty and concerns over government borrowing could limit the extent of the correction.

Source: IE

Gold Prices in 2026 FAQs

Q1: By how much have gold prices fallen in 2026?

Ans: Gold prices in the Delhi market declined by approximately 25% between February 28 and November 20, 2026.

Q2: What is the primary reason behind the fall in gold prices?

Ans: The principal reason is the shift in market expectations from US Federal Reserve interest rate cuts towards further rate hikes, which has reduced gold's attractiveness.

Q3: Why do higher interest rates affect gold prices?

Ans: Gold does not generate interest income. When interest rates rise, interest-bearing investments such as government bonds become more attractive, potentially reducing demand for gold.

Q4: What are the four major sources of global gold demand?

Ans: Investment demand, jewellery, central bank purchases and technology applications are the four major sources of gold demand.

Q5: Why did gold prices rise sharply before February 2026?

Ans: The rally was supported by rising government borrowing, persistent inflation, geopolitical uncertainty and sustained gold purchases by central banks.

Corporate Profits and Wage Growth in India: Why Workers Aren’t Benefiting

Wage Growth in India

Wage Growth in India Latest News

  • Recently, PM Modi sharply criticised Indian industry for failing to pass on the benefits of government reforms — ease of doing business measures and tax cuts — to employees through higher salaries. 
  • Government data strongly supports this criticism: real wages for factory workers have barely moved over the past three years, even as corporate profits have hit record highs as a share of GDP. 
  • This marks the second such high-level rebuke of India Inc, following Finance Minister Nirmala Sitharaman’s similar remarks four years ago.

The Wage Reality: Barely Keeping Pace with Inflation

  • As per the latest Annual Survey of Industries (ASI) data, nominal wages for factory workers rose 5.3% in 2024-25, reaching ₹2.28 lakh annually.
  • However, household inflation was 4.6% in the same period — meaning real wage growth (inflation-adjusted) was just 0.7%.
  • Historical trend is worse: This 0.7% was actually the highest real wage growth in three years — 
    • 2023-24: just 0.1% growth
    • 2022-23: a decline of 1.1%
  • Real wage growth has stayed below 1% in 5 of the last 6 years.
  • The only exception was 2021-22 (4.5% growth) — but this was due to a low base effect, since wages had fallen 5.3% in 2020-21 because of the COVID-19 pandemic.
  • A May 2025 study by the Centre for Social and Economic Progress found wage growth barely kept pace with inflation from 2017-18 to 2023-24.
  • The study described this as the most curious and worrisome aspect of India’s employment scenario, affecting almost all forms of employment across most sectors.

The Widening Worker-Manager Pay Gap

  • 2008-09: Average factory worker wage was ₹68,103; supervisory/managerial wage was ₹4 lakh — a ratio of 5.87 times.
  • 2024-25: Worker wage rose to ₹2.28 lakh; supervisor wage rose to ₹14.5 lakh — a ratio of 6.36 times.
  • Key takeaway: The pay gap between ordinary workers and management has widened, not narrowed, over the 16-year period.

Corporate Profits: Soaring to Record Highs

  • In the July-September 2026 quarter, around 2,600 listed companies (tracked by Bank of Baroda) posted a record net profit of ~₹4.5 lakh crore — up ~26% year-on-year.
  • Concentration Concern: Just 5 companies — Reliance Industries, SBI, Indian Oil, HDFC Bank, and ONGC — accounted for ₹1.12 lakh crore (25%) of this total. Notably, three of these five are government-owned.
  • More broadly, Nifty 500 companies’ profits hit an all-time high of 5.2% of GDP in 2025-26 (per Motilal Oswal Financial Services, June 2026).
  • These 500 companies — representing ~90% of India’s market capitalisation — have seen profits grow three times faster than India’s overall GDP.

The Policy Backstory: Tax Cuts That Didn’t Deliver as Hoped

  • Both the criticisms (by PM and FM) trace back to the corporate tax rate cuts of September 2019, intended to trigger a new private capex cycle and growth rebound.
  • While COVID disrupted this trajectory, headline GDP growth has rebounded strongly since — yet concerns persist about the nature of this recovery: 
    • It is “K-shaped” (uneven across income groups).
    • Wages aren’t rising fast enough despite rapid profit growth.
    • Insufficient job creation.
    • Companies aren’t investing enough, despite the tax cut’s original intent.
  • Importantly, a corporate tax cut doesn’t automatically translate into higher investment or wages — other factors like regulatory constraints matter too, which is why the government has recently pivoted toward deregulation.

Official Acknowledgment of the Disconnect

  • The Economic Survey 2024-25 itself flagged that “the disproportionate rise in corporate profits — predominantly among large firms — raises concerns about income inequality.”
  • Chief Economic Advisor V. Anantha Nageswaran recently stated that India doesn’t have “as much of a jobs problem as an income problem” — reframing the debate from employment quantity to income adequacy.

Why Growth Isn’t Being Felt

  • PM Modi’s remarks came ahead of the November 30 GDP release for July-September 2026; after 7.8% growth in April-June, similar or higher (8%+) growth is widely expected for Q2.
  • Yet a persistent question remains: why isn’t rapid GDP growth being “felt” by ordinary households?
  • The RBI’s consumer confidence surveys show both rural and urban households’ assessment of their current situation and future expectations at multi-year lows — a stark contrast to headline growth figures.

Conclusion

  • The data makes clear that India’s growth story has a distribution problem: profits are surging, but wages for ordinary workers remain largely stagnant in real terms, and the gap between workers and management continues to widen. 
  • Unless this disconnect between corporate prosperity and worker income is addressed, headline GDP growth will keep failing to translate into improved living standards — fuelling the very public disillusionment reflected in depressed consumer confidence.

Source: IE

Wage Growth in India FAQs

Q1: Why are corporate profits and wage growth in India diverging?

Ans: Corporate profits and wage growth in India are diverging because companies have recorded strong profitability while workers' inflation-adjusted earnings have barely increased.

Q2: What is the current trend in real wage growth in India?

Ans: Corporate profits and wage growth in India highlight that factory workers' real wages increased just 0.7% in 2024–25 despite nominal wage growth.

Q3: How has the worker-manager wage gap changed in India?

Ans: Corporate profits and wage growth in India reflect widening inequality, with supervisory and managerial wages rising faster than ordinary factory workers' earnings.

Q4: Why did corporate tax cuts fail to significantly boost wages?

Ans: Corporate profits and wage growth in India suggest tax reductions did not automatically translate into higher wages, investment or sufficient employment generation.

Q5: Why is India's economic growth not improving household incomes adequately?

Ans: Corporate profits and wage growth in India reveal a distributional challenge, as rising company profitability has not translated proportionately into household incomes or living standards.

Stubble Burning Monitoring in India: Why Fire Counts Underestimate Pollution

Stubble Burning

Stubble Burning Latest News

  • Satellites have recorded 16,070 farm-fire incidents across northern India this kharif harvesting season, but experts warn the actual scale of stubble burning could be much higher. 
  • At a high-level inter-ministerial review last month, the Centre acknowledged gaps in satellite-based monitoring and directed district authorities to intensify ground patrols after 3 pm — when satellite coverage is largely unavailable. 
  • This has reignited debate on whether India needs a more robust, standardised method to measure stubble burning’s true extent.

Why Stubble Burning Happens and Why It Matters

  • The post-monsoon period gives farmers only a narrow 10-20 day window (October to mid-November) between paddy harvesting and wheat sowing — prompting large-scale burning of crop residue.
  • This severely degrades air quality across the Indo-Gangetic Plain.
  • As per IITM (Indian Institute of Tropical Meteorology) data, stubble burning can contribute over 30% of Delhi’s PM2.5 during peak season.
  • PM2.5: Particulate matter ≤2.5 micrometres in diameter — a microscopic mix of solid particles and liquid droplets (dust, soot, smoke, chemical aerosols), sourced from vehicles, industry, power plants, and natural events like wildfires.

How Farm Fires Are Currently Tracked

  • India relies on daily thermal-anomaly observations — significant temperature deviations detected by sensors aboard polar-orbiting satellites like Aqua, Suomi-NPP, and Terra (operated by NASA/NOAA).
  • Critical limitation: These satellites detect fires only during fixed overpass windows, mainly 10:30 am to 1:30 pm.
    • Suomi-NPP (with VIIRS sensor): passes at ~1:30 pm, detects fires at 375-metre resolution.
    • Aqua (with MODIS sensor): coarser 1 km resolution; its overpass has shifted from 1:30 pm to ~4 pm since 2023, capturing some later fires.
  • This fire-count data feeds directly into IITM’s emission estimates for Delhi-NCR air quality forecasts — and influences policy decisions, including triggering the Graded Response Action Plan (GRAP) when air quality worsens.

The Core Problem: What Satellites Are Missing

  • A November 2025 ISRO Space Applications Centre study found peak farm-burning activity has shifted to late afternoon/evening in Punjab and Haryana — outside standard satellite detection windows.
  • Analysts noted that VIIRS-based estimates are “inadequate in capturing the near-totality of fire incidences” in Punjab.
  • A 2019 Columbia University-affiliated study found MODIS missed over 90% of fires in northwest India — due to: 
    • Short duration (many fires last under 30 minutes, occurring entirely between satellite passes).
    • Partial burning (common in Haryana), which produces weaker thermal signals harder to detect.
  • Using South Korea’s GEO-KOMPSAT-2A satellite, a 2026 study found a sharp spike in fires after 4 pm — a trend building since 2022. 
  • Crucially, aerosol pollution rose between 2022-2025 even as official satellite fire counts fell — exposing the detection gap.
  • Cloud cover is another persistent challenge, frequently flagged by the Indian Agricultural Research Institute, which obstructs satellite observation over northern states.

The Paradox: Fewer Fires Detected, More Area Burnt

  • At an October 2026 inter-ministerial review, authorities called for ground surveillance to supplement satellite data, especially post-3 pm.
  • iFOREST (International Forum for Environment, Sustainability and Technology) assessment revealed a striking contradiction: 
    • Haryana: Recorded fire incidents fell from 1,406 (2024) to 662 (2025), but satellite-derived Burnt Area (BA) actually increased from 7,117 sq km to 8,812 sq km.
    • Punjab: Incidents fell from 10,909 to 5,114, while BA fell much less sharply — from 23,262 sq km to 19,757 sq km.
  • This shows fire-count data alone can be misleading — fewer detected fires don’t necessarily mean less actual burning.

Burnt-Area (BA) Mapping: A More Reliable Alternative

  • Unlike active-fire detection (which only captures fires at the moment of satellite observation), BA mapping detects changes to land surface left behind after burning.
  • Burning alters how ground reflects sunlight, especially in near-infrared and shortwave-infrared wavelengths — creating “burn signatures” detectable even after smoke clears.
  • Key indices used: 
    • NDVI (Normalised Difference Vegetation Index): measures vegetation greenness.
    • NBR (Normalised Burn Ratio): compares near-infrared/shortwave-infrared reflectance; a fall in NBR signals vegetation damage/burnt surface.
  • As per the experts, burnt area signal is weaker but lasts longer. BA products are much more accurate than [active fire detection] to estimate total area affected.
    • ESA’s Sentinel-2 satellites (used for internal BA assessments in India) offer up to 10-metre resolution and revisit areas every 5 days.

Why Even BA Mapping Has Limitations

  • Crop-residue fires are smaller and less intense than wildfires (less biomass involved), making medium-resolution sensors (MODIS, Sentinel-3) less sensitive to agricultural fires.
  • Harvesting itself alters a field’s spectral signature — exposing soil and residue — which can resemble burn signatures, making it hard to distinguish genuinely burnt patches from merely harvested fields.
  • The short gap between harvesting and next sowing means burn scars change quickly as fields are ploughed/prepared, while cloud cover further limits usable imagery.
  • Satellite-derived BA maps require regular validation against higher-resolution imagery for accuracy.

Conclusion

  • India’s reliance on active-fire counts alone risks significantly underestimating the true scale of stubble burning, given satellite blind spots around timing, fire intensity, and cloud cover. 
  • Combining ground surveillance with burnt-area mapping — despite its own technical challenges — offers a more accurate, holistic picture, essential for designing effective pollution-control policies across the Indo-Gangetic Plain.

Source: IE

Stubble Burning FAQs

Q1: Why is stubble burning monitoring in India considered inadequate?

Ans: Stubble burning monitoring in India relies heavily on satellite fire counts, which miss fires occurring outside observation windows, smaller fires and cloud-obstructed areas.

Q2: Why do satellites miss stubble-burning incidents in India?

Ans: Stubble burning monitoring in India faces satellite limitations because fires may occur after afternoon overpasses, last briefly, produce weak signals or remain cloud-obstructed.

Q3: Why can fewer recorded farm fires indicate more burning?

Ans: Stubble burning monitoring in India can underestimate actual burning because declining detected fire counts may coexist with increasing burnt-area measurements.

Q4: How can burnt-area mapping improve stubble burning monitoring in India?

Ans: Stubble burning monitoring in India can improve through burnt-area mapping, which detects post-burning land-surface changes and provides a more comprehensive estimate of affected areas.

Q5: What measures can strengthen stubble burning monitoring in India?

Ans: Stubble burning monitoring in India requires combining satellite observations, ground surveillance, high-resolution imagery and regular validation of burnt-area maps for accurate assessment.

Enquire Now