Poverty Reduction in India Latest News
- The World Bank’s October 2026 Poverty and Equity Brief reported a significant decline in India's extreme poverty rate to 2.6% in 2023, from 27.1% in 2011, while highlighting persistent wage disparities and regional concentration of poverty.
Understanding Poverty and Its Measurement
- Poverty is a multidimensional development challenge involving inadequate income, limited access to essential services and insufficient opportunities for a dignified standard of living. It is generally assessed through two broad approaches:
- Monetary poverty: Measures whether individuals or households have sufficient income or consumption expenditure to meet a defined poverty threshold.
- Multidimensional poverty: Assesses deprivation across indicators such as health, education and living standards.
- The World Bank uses international poverty lines expressed in purchasing power parity (PPP) terms to compare poverty across countries.
Purchasing Power Parity (PPP)
- PPP measures the relative purchasing power of currencies by accounting for differences in the prices of goods and services across countries.
- It helps compare living standards by estimating how much of a common basket of goods and services can be purchased in different economies.
- The World Bank's revised international poverty lines include:

- These thresholds are expressed in 2021 PPP terms. They should not be directly converted using prevailing market exchange rates.
India's Progress in Poverty Reduction
- According to the World Bank's October 2026 Poverty and Equity Brief, India has recorded one of the fastest reductions in poverty globally over the past decade.
- Between 2011 and 2023, the proportion of India's population living below the lower-middle-income poverty line of $4.20 per day declined from 57.7% to 16.1%. This represents an estimated 496 million people moving above that poverty threshold.
- Extreme poverty also declined substantially, from 27.1% in 2011 to 2.6% in 2023.
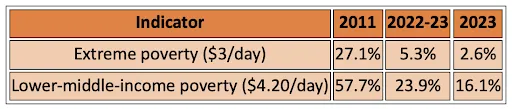
- The reduction in extreme poverty between 2022-23 and 2023 indicates that the rate was approximately halved over the period.
Multidimensional Poverty Reduction
- India has also made progress in reducing non-monetary deprivation.
- The World Bank's brief highlighted the following trends:
- India's Multidimensional Poverty Index (MPI), based on the Oxford Poverty and Human Development Initiative (OPHI) methodology, declined from 53.8% in 2005-06 to 16.4% in 2019-21.
- The World Bank's MPI measure for India stood at 15.5% in 2022-23.
- These indicators suggest improvements extending beyond household consumption and income.
Factors Behind Poverty Reduction
- The World Bank identified multiple factors contributing to India's progress:
- Strong consumption growth: Rising household consumption has contributed to improvements in living standards.
- Employment expansion: Employment increased by approximately 13.4 crore people between 2017 and 2023, nearly twice the growth in the working-age population.
- Women's workforce participation: Much of the employment increase was driven by rural women entering paid work, increasing the number of earners within households.
- Social transfers: Expanded government support, including food subsidies, contributed to improved household welfare.
Persistent Challenges: Inequality and Regional Concentration
- Despite substantial progress, the World Bank identified structural challenges that could affect the sustainability and inclusiveness of poverty reduction.
- Wage Inequality
- Wage disparities remain pronounced in India. In 2023, median earnings among the top 10% of workers were approximately 13 times those of the bottom 10%.
- At the same time, the consumption-based Gini index declined from 28.8 in 2011-12 to 25.5 in 2022-23 and further to 23.0 in 2023.
- However, the World Bank cautioned that household consumption surveys may not fully capture the consumption of wealthier households and could therefore understate inequality.
- Geographical Concentration of Poverty
- Poverty is becoming increasingly concentrated geographically. Approximately 57% of India's poor population lives in a contiguous belt stretching from Uttar Pradesh to West Bengal.
- This concentration means that further poverty reduction will depend substantially on improving economic opportunities and creating productive employment in these States.
- Employment Quality and Youth Unemployment
- Although employment expanded significantly between 2017 and 2023, the World Bank noted that real earnings remained broadly unchanged, with employment growth concentrated in relatively low-productivity activities.
- Youth unemployment also increased from 14.6% in the first quarter of FY2025-26 to 15.9% in the corresponding quarter of FY2026-27. The increase was particularly notable among rural young women.
- These trends highlight the distinction between employment generation and the creation of stable, productive and adequately remunerated jobs.
Future Poverty Projections
- The World Bank expects poverty in India to continue declining, although at a more gradual pace.
- According to its projections, the proportion of the population below the $4.20-per-day lower-middle-income poverty line is expected to decline to 14.2% in 2026 and further to 12.1% by 2028.
Poverty Reduction in India FAQs
Q1: What is India's extreme poverty rate according to the World Bank's October 2026 brief?
Ans: India's extreme poverty rate declined to 2.6% in 2023, from 27.1% in 2011, using the $3-per-day poverty line in 2021 PPP terms.
Q2: What is the lower-middle-income poverty line?
Ans: The World Bank's lower-middle-income poverty threshold is $4.20 per person per day in 2021 PPP terms.
Q3: What is Purchasing Power Parity (PPP)?
Ans: PPP compares the purchasing power of currencies by accounting for differences in the prices of goods and services across countries.
Q4: How many people moved above India's lower-middle-income poverty threshold between 2011 and 2023?
Ans: The World Bank estimated that approximately 496 million people moved above the $4.20-per-day poverty threshold during this period.
Q5: What is India's Multidimensional Poverty Index trend?
Ans: The OPHI-based MPI declined from 53.8% in 2005-06 to 16.4% in 2019-21, while the World Bank's MPI measure stood at 15.5% in 2022-23.