The Multidimensional Poverty Index (MPI) goes beyond traditional income-based measures to evaluate poverty through various deprivations that people face in their daily lives. It includes factors like education, health, and living standards to capture the real extent of hardship. The 2025 Global MPI, released on October 17, 2025, marks a significant milestone by combining climate hazard data with poverty measures, highlighting how environmental risks and poverty are deeply connected across the world.
Multidimensional Poverty Index
The Multidimensional Poverty Index (MPI) is an international measure of poverty developed by the United Nations Development Programme (UNDP) and the Oxford Poverty and Human Development Initiative (OPHI). Unlike monetary poverty, which measures income alone, MPI identifies people who are deprived in multiple aspects of life such as education, health, and standard of living.
Each of these three dimensions carries several specific indicators. A household is considered multidimensionally poor when it is deprived in at least one-third of the weighted indicators. The MPI value ranges from 0 to 1, where a lower value indicates better performance. It serves as a crucial policy tool for governments to monitor and address poverty more effectively.
Multidimensional Poverty Index 2025
The Global MPI Report 2025, titled “Overlapping Hardships: Poverty and Climate Hazards”, presents an in-depth look at how poverty and environmental vulnerability overlap. It evaluates data from 109 countries, with subnational estimates for 1,359 regions across 101 nations. Key Findings from MPI 2025 Report:
- 1.1 billion people out of 6.3 billion live in acute multidimensional poverty.
- More than 50% of the poor are children, highlighting generational vulnerability.
- Around 740 million poor people, approximately 64.5%, live in middle-income countries.
- 887 million poor individuals are exposed to at least one of four major climate hazards: high heat, drought, floods, and air pollution.
- Among these, 309 million face three or four concurrent hazards, intensifying their hardship.
- Common deprivations include lack of clean cooking fuel, housing, sanitation, nutrition, and electricity.
- India’s MPI value stands at 0.069, indicating significant progress compared to past years.
Multidimensional Poverty Index Indicators
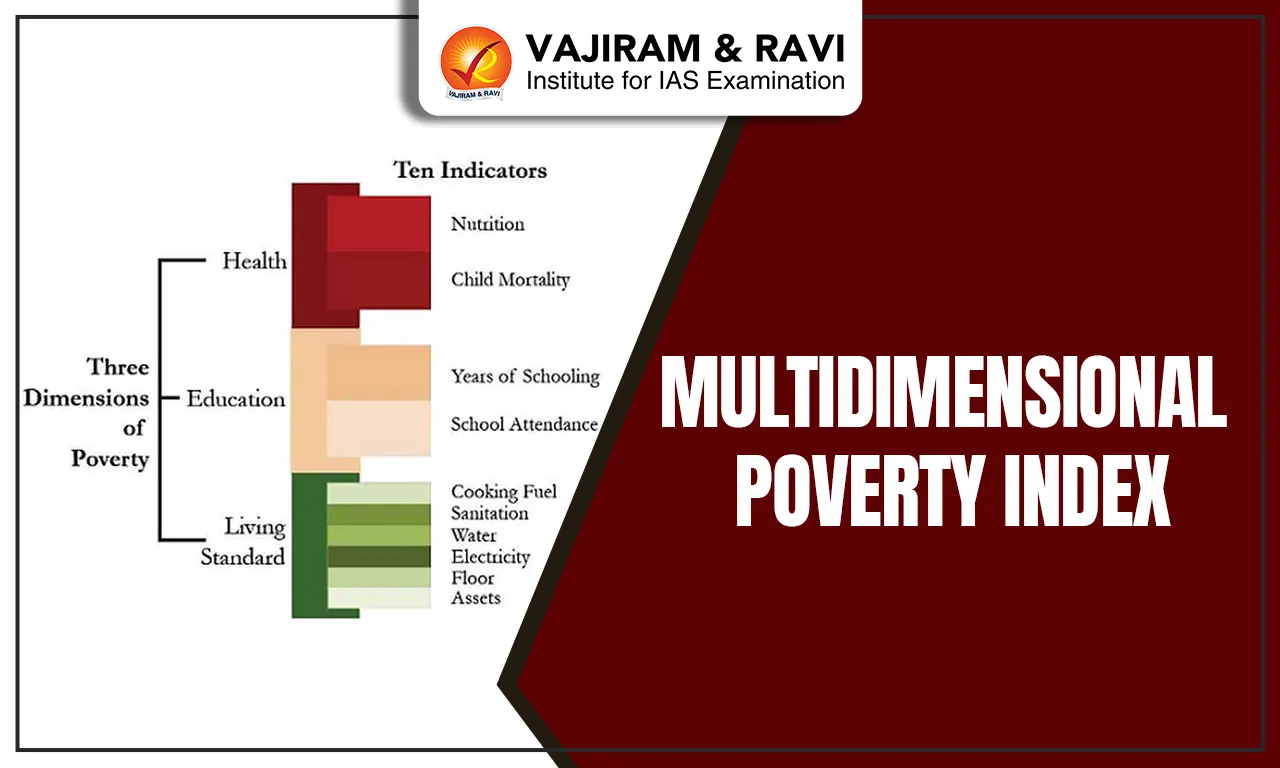
The Multidimensional Poverty Index measures deprivation through three key dimensions, each containing specific indicators. Every indicator is assigned a particular weight, contributing to the overall MPI score.
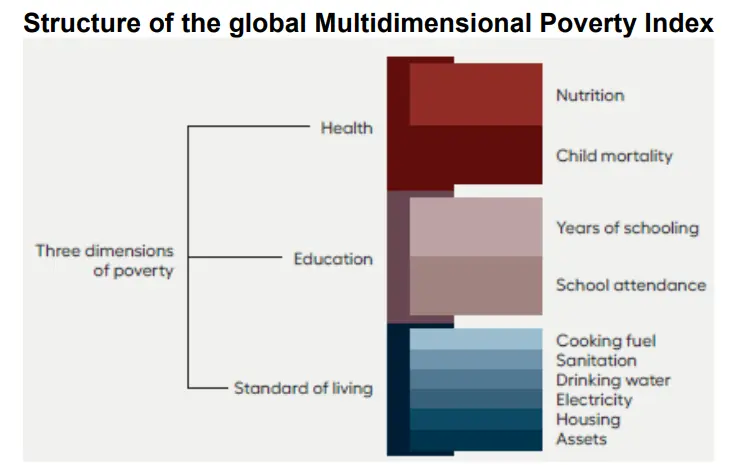
- Health (1/3 Total Weight)
-
- Nutrition (1/6): A person is deprived if any adult or child in the household is undernourished.
- Child Mortality (1/6): A family is deprived if any child under 18 has died in the past five years.
- Education (1/3 Total Weight)
-
- Years of Schooling (1/6): Deprivation occurs if no household member above school entrance age + six years has completed six years of schooling.
- School Attendance (1/6): A household is deprived if any school-aged child is not attending school up to class eight.
- Standard of Living (1/3 Total Weight)
-
- Cooking Fuel (1/18): Using wood, charcoal, dung, or coal counts as deprivation.
- Sanitation (1/18): Sanitation is considered deprived if facilities are unimproved or shared with other households.
- Drinking Water (1/18): If improved water is unavailable or over a 30-minute round trip away, it is deprived.
- Electricity (1/18): Absence of electricity is a deprivation.
- Housing (1/18): If walls, roof, or floor are made from natural or rudimentary materials, it is deprived.
- Assets (1/18): If the household owns fewer than one asset such as a radio, TV, or bicycle, and no vehicle, it is deprived.
Multidimensional Poverty Index Calculation
The Multidimensional Poverty Index is calculated using a systematic and data-driven process. It includes the following steps:
- Identification of Deprivations: Each household is assessed across the ten indicators.
- Scoring: Each indicator is given a specific weight, and households are assigned scores based on their deprivation status.
- Cut-off Point: If the cumulative deprivation score is 33% or more, the household is identified as multidimensionally poor.
- Headcount Ratio (H): This represents the proportion of people identified as poor.
- Intensity (A): It measures the average proportion of indicators in which poor people are deprived.
- MPI Value (H × A): The final MPI score is obtained by multiplying the Headcount Ratio and Intensity.
Multidimensional Poverty Index India
India’s multidimensional poverty reduction has been a global success story. Between 2015-16 and 2019-21, around 135 million people escaped multidimensional poverty according to earlier MPI findings.
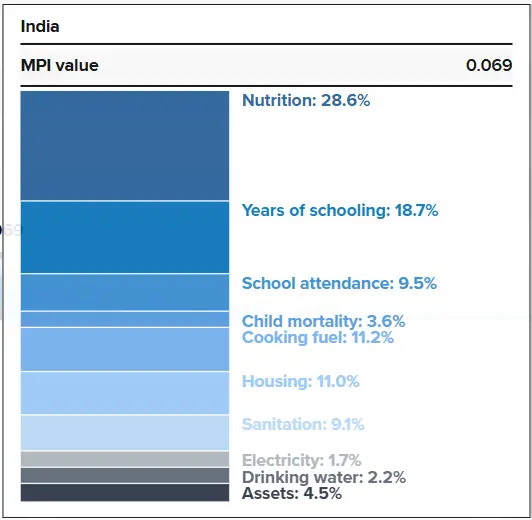
The national MPI value of 0.069 reflects a headcount ratio of 16.4%, meaning that about 16 out of every 100 Indians experience multidimensional poverty. The intensity of deprivation stands at 42%, which is the average proportion of indicators in which poor people are deprived. Breakdown by major dimensions:
- Health deprivation: 32.2%
- Education deprivation: 28.2%
- Standard of living: 39.7%
States like Bihar, Jharkhand, Uttar Pradesh, and Madhya Pradesh still have higher MPI values, showing deeper deprivations. In contrast, states such as Kerala, Tamil Nadu, and Goa perform far better, with very low poverty intensity and higher educational attainments.
Kerala to Announce Extreme Poverty Free Status
On November 1, 2025, Kerala will become the first Indian state officially declared free from extreme poverty. The Extreme Poverty Eradication Programme, launched in 2021, identified 64,006 extremely poor families through detailed surveys assessing deprivation in food, health, livelihood, and shelter. Following this, micro-plans were prepared for each family, ensuring access to essentials like housing, land, and documents. As of 2025, 59,277 families have been successfully uplifted. Kerala’s poverty rate, just 0.7% (NITI Aayog, 2021), is the lowest in India. The official declaration will be made by Chief Minister Pinarayi Vijayan in Thiruvananthapuram, marking a historic milestone.
Multidimensional Poverty Index Challenges
Despite global progress, multidimensional poverty remains a critical challenge. The intertwining of poverty and climate vulnerability is one of the biggest threats of the 21st century. The 2025 report highlights several ongoing challenges that demand urgent global attention.
- Climate and Environmental Risks: Nearly 887 million poor people live in regions facing at least one major climate hazard, and 309 million face multiple hazards. Droughts, floods, and extreme heat directly impact livelihoods, food security, and health, pushing millions back into poverty.
- Unequal Access to Resources: Inequality persists both within and between countries. Rural areas continue to lag behind in sanitation, drinking water, and energy access, showing that infrastructure development remains incomplete.
- Child Poverty: Children constitute more than half of the global multidimensionally poor population. Malnutrition, low school attendance, and poor living standards threaten their long-term development.
- Data Gaps and Measurement Challenges: Many low-income countries lack regular data collection, making it difficult to monitor poverty reduction accurately. Reliable and timely data are essential for effective policy interventions.
- Policy Fragmentation: Policies addressing poverty often operate in silos, missing the interconnected nature of deprivations. Integrating environmental and social policies is key to sustainable poverty alleviation.
Way Forward:
- Integrated Development Approach: Governments must combine poverty reduction with climate adaptation strategies.
- Focus on Education and Skill Development: Education remains a critical tool for breaking poverty cycles.
- Inclusive Growth Policies: Ensuring equitable access to healthcare, housing, and sanitation can accelerate progress.
- Community Participation: Local empowerment and decentralized planning can enhance efficiency in poverty eradication.
- Data-Driven Decision Making: Expanding data collection and sharing across regions will improve monitoring and accountability.
- International Cooperation: Richer nations and global institutions must provide financial and technical assistance to developing countries.
Multidimensional Poverty Index UPSC
The 2025 Global Multidimensional Poverty Index reminds the world that poverty is not just about income, it is about overlapping hardships that affect human dignity and opportunity. India’s progress, especially the success of states like Kerala, shows that strategic investment in health, education, and social protection can yield powerful results. However, the growing link between poverty and climate hazards calls for renewed global commitment to building a poverty-free and climate-resilient future.
This year’s report provides valuable insight into how climate change and poverty interact, stressing that countries facing the steepest temperature rises are often those already struggling with high poverty rates.
Multidimensional Poverty Index FAQs
Q1: What is the Multidimensional Poverty Index (MPI)?
Ans: The MPI measures poverty using multiple indicators beyond income, including health, education, and living standards, developed by UNDP and Oxford University.
Q2: What is India’s MPI value in 2025?
Ans: As per the 2025 Global MPI Report, India’s MPI value is 0.069, reflecting a steady improvement in multidimensional poverty reduction.
Q3: How many people live in multidimensional poverty globally in 2025?
Ans: According to the UNDP Global MPI 2025, around 1.1 billion people across 109 countries live in acute multidimensional poverty.
Q4: Which states in India have the lowest multidimensional poverty?
Ans: Kerala, Tamil Nadu, and Himachal Pradesh have the lowest multidimensional poverty levels, due to better education, health, and infrastructure outcomes.
Q5: How is the MPI different from income-based poverty?
Ans: Unlike income measures, the MPI considers ten indicators across three dimensions, health, education, and standard of living, to capture holistic poverty levels.
