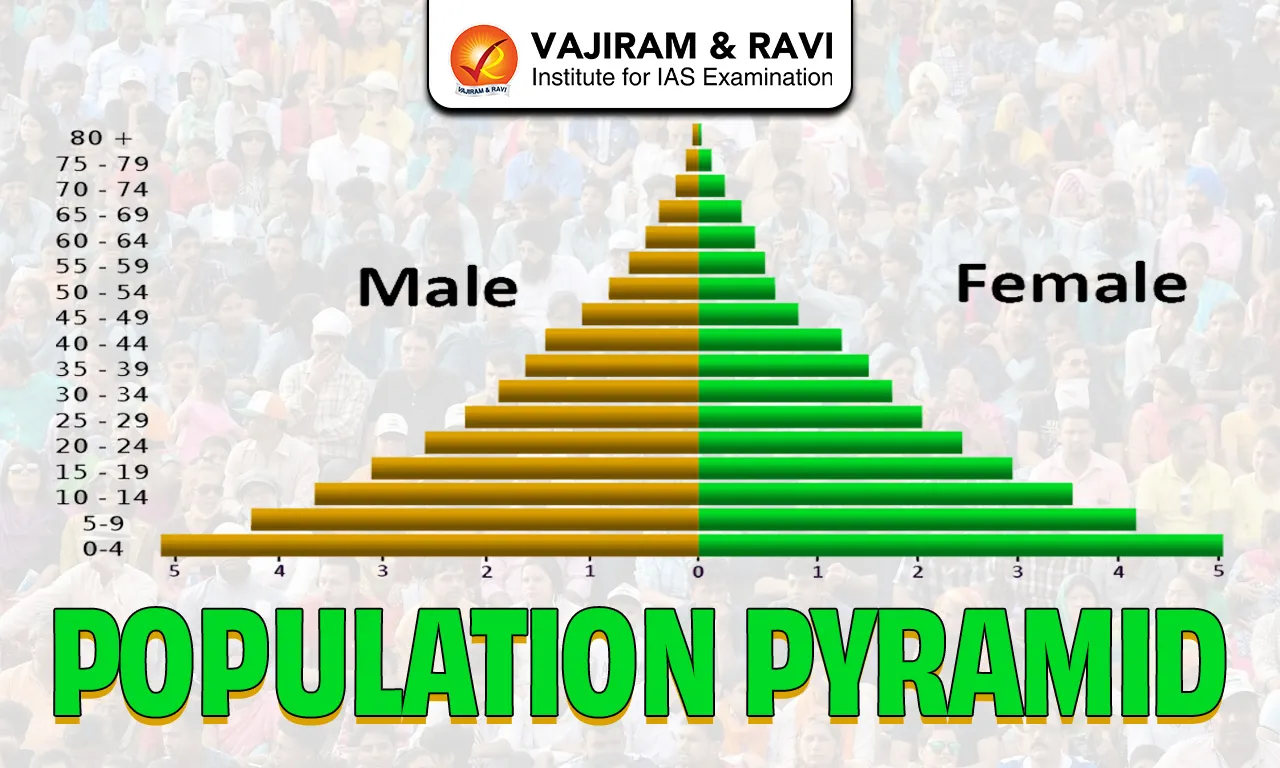
A Population Pyramid is a graphical representation that shows the distribution of a country’s population by age and gender. It helps in understanding population structure, workforce availability, and dependency levels. The shape of the pyramid reflects trends in birth rate, death rate, and life expectancy. It is an important tool in demography for analyzing population growth and future planning.
Population Pyramid Types
There are three major types of population pyramids based on their shape and demographic characteristics. Each type reflects a different stage of population growth and economic development.
1. Expansive Population Pyramid
An Expansive Population Pyramid has a broad base and a narrow top, showing a high birth rate and rapid population growth. It is commonly seen in developing countries with a large young population.
- Broad Base: Indicates a high number of children (0-14 years).
- High Birth Rate: Families tend to have more children due to social and economic factors.
- High Population Growth: Birth rate is much higher than death rate.
- Low Life Expectancy: Smaller proportion of elderly people.
- High Child Dependency Ratio: Large non-working population depends on the working-age group.
- Pressure on Resources: Heavy demand for schools, hospitals, housing, and employment.
- Agrarian Economy Link: Often associated with rural and agriculture-based economies.
- Future Workforce Potential: Can result in demographic dividend if properly utilized.
- Common in Developing Nations: Seen in economically less developed countries.
2. Stationary Population Pyramid
A Stationary Population Pyramid has a nearly rectangular shape, showing low birth and death rates. It represents stable population growth and balanced age distribution.
- Rectangular Shape: Similar width across most age groups.
- Low Birth Rate: Fewer children are being born compared to expansive type.
- Low Death Rate: Better healthcare and sanitation systems.
- Stable Population Growth: Birth rate and death rate are almost equal.
- Balanced Age Structure: Even distribution of children, adults, and elderly.
- Moderate Dependency Ratio: Both child and old-age dependency are manageable.
- High Life Expectancy: Larger proportion of people living to old age.
- Economic Stability: Indicates developed and stable economy.
- Higher Literacy & Urbanization: Education and women empowerment reduce fertility.
3. Constrictive Population Pyramid
A Constrictive Population Pyramid has a narrow base and wider middle or top, indicating very low birth rates and an aging population. It is typical of highly developed countries facing population decline.
- Narrow Base: Fewer children due to very low fertility rate.
- Wider Middle: Large working-age adult population.
- Broad Top: Higher proportion of elderly people.
- Aging Population: Increasing percentage above 60–65 years.
- Low or Negative Growth Rate: Population growth is slow or declining.
- High Old-Age Dependency Ratio: More elderly depend on fewer workers.
- Labor Shortage Risk: Shrinking workforce over time.
- Higher Pension & Healthcare Burden: Increased government spending on elderly care.
- Common in Developed Countries: Seen in advanced industrial economies.
Population Pyramid of India
India’s population pyramid has been gradually transforming over the past few decades due to declining fertility rates, improving healthcare, and rising life expectancy.
- Broad but Gradually Narrowing Base: India still has a significant young population, but fertility rates have declined in many states, reducing the width of the base compared to earlier decades.
- Large Working-Age Population (15–59 Years): A substantial proportion of the population falls within the productive age group, providing an opportunity for economic growth.
- Demographic Dividend Phase: India is currently experiencing a demographic dividend, where the working-age population is larger than the dependent population.
- Declining Total Fertility Rate (TFR): Fertility rates have fallen close to or below replacement levels in several states, signaling a shift toward stabilization.
- Increasing Life Expectancy: Improvements in healthcare, nutrition, and sanitation have increased survival rates and expanded older age groups.
- Rising Elderly Population: The share of people aged 60+ is steadily increasing, which may raise old-age dependency in the future.
- Regional Variations: Southern and western states show more stationary patterns, while some northern states still reflect expansive characteristics.
Factors Affecting the Shape of a Population Pyramid
The shape of a Population Pyramid is not random; it reflects the demographic, social, and economic conditions of a country. Changes in birth rate, death rate, migration, and development level directly influence whether the pyramid appears expansive, stationary, or constrictive.
- Birth Rate (Fertility Rate): A high birth rate widens the base of the pyramid, while a low birth rate narrows it. Countries with high fertility show an expansive shape, whereas low fertility leads to a constrictive pattern.
- Death Rate (Mortality Rate): High death rates reduce the number of people reaching older age groups, narrowing the upper portion. Lower death rates increase survival and widen the top.
- Life Expectancy: Higher life expectancy increases the proportion of elderly people, making the top broader. Lower life expectancy keeps the pyramid narrow at the top.
- Infant Mortality Rate: High infant mortality can slightly reduce the width of the lower age groups despite high birth rates. Improved healthcare reduces infant deaths and maintains a broad base.
- Migration (Immigration & Emigration): Immigration increases the working-age population, widening the middle section. Emigration of young workers can shrink the productive age group.
- Economic Development: Developed countries generally have low fertility and aging populations (constrictive shape), while developing countries have higher fertility (expansive shape).
- Urbanization: Urban populations tend to have fewer children due to higher living costs and career priorities, narrowing the base.
- Women’s Education and Employment: Higher female literacy and workforce participation usually lead to delayed marriages and fewer children.
- Government Policies: Family planning programs, pro-natalist policies, healthcare improvements, and social security schemes significantly affect population structure.
- Cultural and Social Norms: Traditions, early marriage practices, and preference for larger families influence fertility patterns.
- Healthcare Facilities: Access to better healthcare reduces mortality rates and increases life expectancy, widening the upper age groups.
Population Pyramid and Demographic Transition Theory
The Population Pyramid visually represents a country’s age and sex composition, while the Demographic Transition Theory (DTT) explains how birth and death rates change as a country develops economically. Together, they help us understand population growth patterns and predict future demographic trends.
Demographic Transition Theory describes the transformation of a country’s population structure through stages linked with industrialization and development.
- High Stationary Stage (Stage 1)
- In this stage, both the birth rate and death rate are very high.
- The population growth remains very low because births and deaths are almost equal.
- Poor medical facilities and lack of sanitation lead to high mortality.
- Life expectancy is low due to diseases, famine, and limited healthcare.
- The population pyramid shows an expansive shape with a broad base and narrow top.
- Early Expanding Stage (Stage 2)
- In this stage, the birth rate remains high while the death rate begins to decline.
- The decline in death rate occurs due to improvements in healthcare, sanitation, and food supply.
- The population grows rapidly because more people survive to adulthood.
- Agricultural and medical advancements reduce mortality significantly.
- The population pyramid becomes very wide at the base, indicating rapid growth.
- Late Expanding Stage (Stage 3)
- In this stage, the birth rate starts to decline gradually.
- The death rate remains low due to continued medical progress.
- Population growth slows down compared to the previous stage.
- Urbanization, education, and women’s empowerment contribute to lower fertility.
- The population pyramid begins to narrow at the base, moving toward a stationary shape.
- Low Stationary Stage (Stage 4)
- In this stage, both birth rate and death rate are low.
- The population growth becomes stable or very slow.
- Life expectancy is high because of advanced healthcare systems.
- The population structure becomes balanced across different age groups.
- The population pyramid appears rectangular or stationary in shape.
- Declining Stage (Stage 5)
- In this stage, the birth rate falls below the replacement level.
- The death rate remains low but may slightly increase due to aging population.
- The overall population begins to decline over time.
- The proportion of elderly people increases significantly.
- The population pyramid takes a constrictive shape with a narrow base and wider top.
Population Pyramid FAQs
Q1: What is a population pyramid?
Ans: A population pyramid is a graphical representation of the age and sex structure of a population.
Q2: How many types of population pyramids are there?
Ans: There are three main types: Expansive, Stationary, and Constrictive.
Q3: Why is the population pyramid important?
Ans: It helps in understanding workforce availability, dependency ratio, economic planning, and future growth trends.
Q4: What does a broad base indicate?
Ans: A broad base indicates a high birth rate and rapid population growth.
Q5: What is India’s current population pyramid type?
Ans: India is transitioning from an expansive to a more stationary population structure.