Income and wealth inequality are important indicators of a country’s socio-economic health. Economists use statistical tools like the Lorenz Curve and Gini Coefficient to measure how evenly income or wealth is distributed among the population. These concepts help governments design welfare policies and assess inclusive growth. India’s position in the Gini Index reflects its progress and challenges in achieving economic equality.
What is Lorenz Curve?
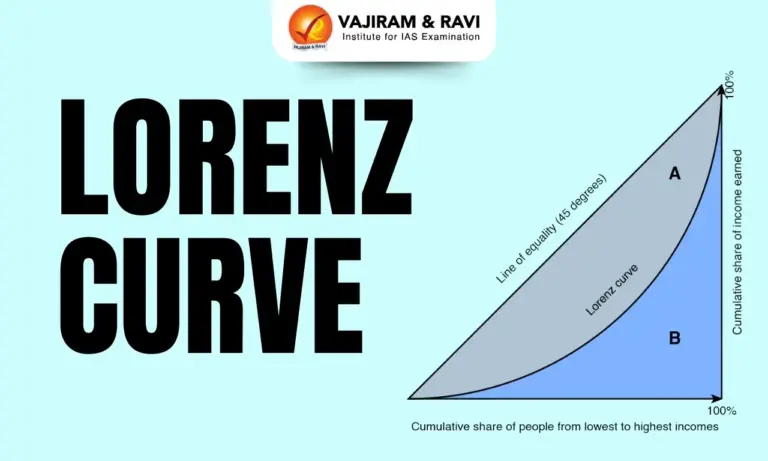
The Lorenz Curve is a graphical representation used to show the distribution of income or wealth within a population. It compares the cumulative percentage of population (from poorest to richest) with the cumulative percentage of income or wealth they receive.
In a perfectly equal society, every individual earns the same income, and the Lorenz Curve coincides with the Line of Equality (a 45-degree straight line). Any deviation of the Lorenz Curve below this line indicates the presence of inequality, with greater deviation showing higher inequality.
Lorenz Curve and Gini Coefficient
The value of the Gini Coefficient ranges from 0 to 1, where 0 represents perfect equality and 1 represents perfect inequality. A higher Gini value indicates greater income inequality. While the Lorenz Curve provides a visual understanding, the Gini Coefficient allows easy comparison between countries, regions, or time periods.


India’s Rank in Gini Index
- India ranks fourth globally in income equality with a Gini Index score of 25.5, according to the World Bank, placing it just behind the Slovak Republic, Slovenia, and Belarus.
- The country falls in the “moderately low inequality” category (25–30) and is very close to entering the low-inequality group, which includes only a few countries worldwide.
- India’s Gini score is significantly lower than China (35.7) and the United States (41.8), indicating a more equal income distribution compared to many major economies.
- Among over 170 countries, India performs better than all G7 and G20 nations in terms of income equality, despite being one of the world’s largest and most diverse economies.
- India’s inequality level has steadily improved over time, with the Gini Index declining from 28.8 in 2011 to 25.5 in 2022, showing consistent progress toward inclusive growth.
- The improvement in India’s Gini ranking is closely linked to large-scale poverty reduction, as 171 million people moved out of extreme poverty between 2011 and 2023.
- According to the World Bank, extreme poverty fell to 2.3% in 2022–23 under the $2.15 per day threshold, contributing to a more balanced income distribution.
- Targeted welfare and inclusion schemes such as Jan Dhan Yojana, Direct Benefit Transfer, Ayushman Bharat, and PMGKAY have played a key role in narrowing income gaps.
Lorenz Curve Significance
The Lorenz Curve plays a crucial role in economic analysis and policy formulation. Its importance can be understood through the following points:
- Visual Representation of Inequality: The Lorenz Curve clearly shows how income or wealth is distributed across the population. A curve closer to the Line of Equality indicates more equitable distribution.
- Basis for Gini Coefficient: It forms the foundation for calculating the Gini Coefficient, a widely used measure of inequality, allowing comparisons between countries or regions.
- Policy Assessment Tool: Policymakers use it to evaluate the effectiveness of welfare schemes, subsidies, and taxation in reducing economic disparities.
- Tracking Changes Over Time: By comparing Lorenz Curves from different years, economists can track trends in inequality and monitor whether growth benefits all sections of society.
- Identifying Social Imbalances: It highlights which segments of the population earn disproportionately low or high income, helping target interventions to the needy.
- Supporting Inclusive Growth: The Lorenz Curve helps design policies that aim for equitable economic development, ensuring that growth reaches marginalized and vulnerable groups.
![]() Last updated on March, 2026
Last updated on March, 2026
→ UPSC Final Result 2025 is now out.
→ UPSC has released UPSC Toppers List 2025 with the Civil Services final result on its official website.
→ Anuj Agnihotri secured AIR 1 in the UPSC Civil Services Examination 2025.
→ UPSC Marksheet 2025 is now out.
→ UPSC Notification 2026 & UPSC IFoS Notification 2026 is now out on the official website at upsconline.nic.in.
→ UPSC Calendar 2026 has been released.
→ Check out the latest UPSC Syllabus 2026 here.
→ UPSC Prelims 2026 will be conducted on 24th May, 2026 & UPSC Mains 2026 will be conducted on 21st August 2026.
→ The UPSC Selection Process is of 3 stages-Prelims, Mains and Interview.
→ Prepare effectively with Vajiram & Ravi’s UPSC Prelims Test Series 2026 featuring full-length mock tests, detailed solutions, and performance analysis.
→ Enroll in Vajiram & Ravi’s UPSC Mains Test Series 2026 for structured answer writing practice, expert evaluation, and exam-oriented feedback.
→ Join Vajiram & Ravi’s Best UPSC Mentorship Program for personalized guidance, strategy planning, and one-to-one support from experienced mentors.
→ Shakti Dubey secures AIR 1 in UPSC CSE Exam 2024.
→ Also check Best UPSC Coaching in India
Lorenz Curve FAQs
Q1. What is a Lorenz Curve?+
Q2. What does the Lorenz Curve indicate?+
Q3. What is the Line of Equality?+
Q4. How is the Lorenz Curve related to the Gini Coefficient?+
Q5. Can the Lorenz Curve be used for things other than income?+
Tags: lorenz curve