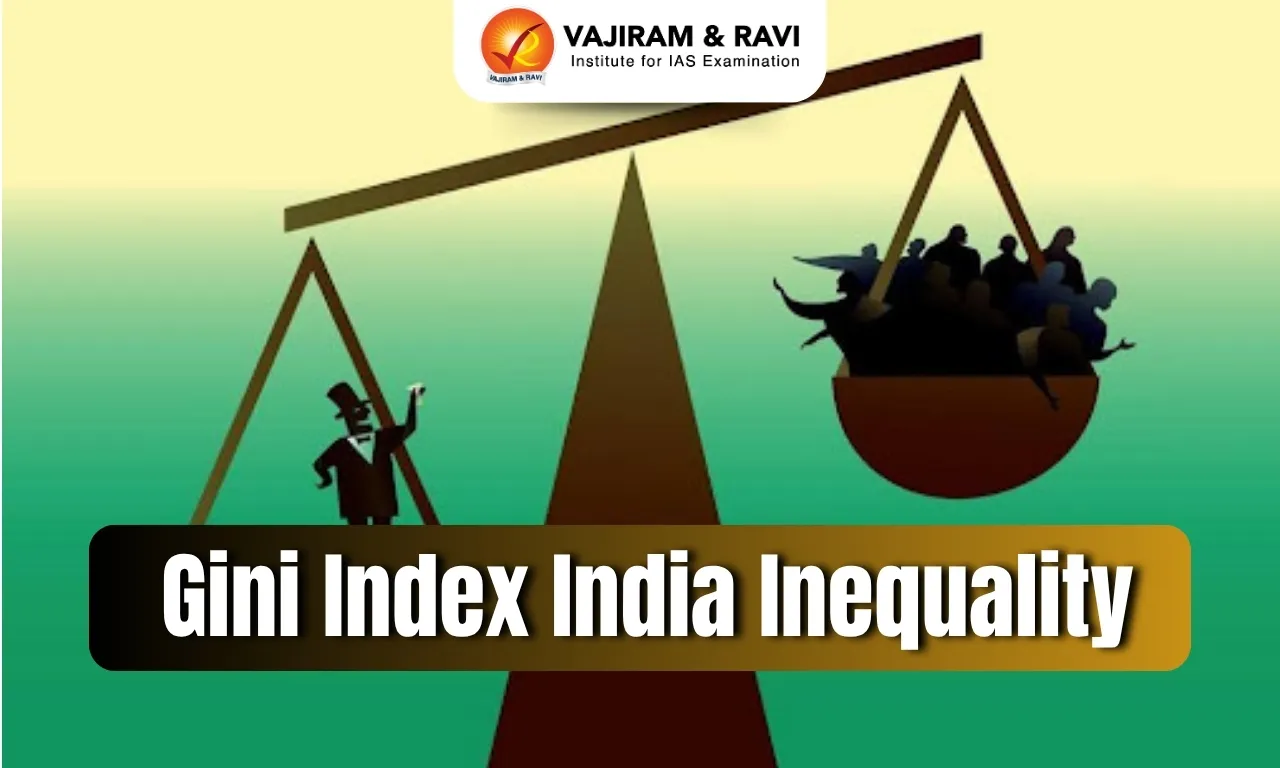
Gini Index India Inequality Latest News
- A government release claimed that India is now the world’s fourth most equal country, citing a Gini Index of 25.5 from the World Bank’s Poverty and Equity Brief.
- This, it said, reflects that the benefits of economic growth are being shared more evenly.
- However, this claim—ranking India just behind Slovak Republic, Slovenia, and Belarus—has been contested by academics and observers, many of whom regard India as a country with high inequality.
- The Gini Index measures income inequality on a scale from 0 (perfect equality) to 1 (perfect inequality).
Data Discrepancy and Omitted Caveats
- The government’s claim citing the World Bank’s Gini Index of 25.5 omits critical qualifiers from the World Bank’s Poverty and Equity Brief.
- The brief notes that inequality may be underestimated due to data limitations.
- In contrast, the World Inequality Database indicates that income inequality in India has risen, with the Gini Index increasing from 52 in 2004 to 62 in 2023.
- It also highlights high wage disparity, with the top 10% earning 13 times more than the bottom 10% in 2023–24.
- Thus, the official narrative fails to capture the full and accurate picture of inequality.
Why Consumption-Based Gini Understates Inequality
- The consumption-based Gini Index shows lower inequality because it measures variations in spending, not earnings or wealth.
- Income inequality reflects broader disparities, as higher earners often save more, reducing their consumption gap with others.
- Consequently, using consumption data underestimates real inequality.
- Experts caution against comparing India’s consumption-based Gini with other countries that use income-based measures, calling such comparisons misleading and inaccurate.
Why Survey Data Fails to Reflect True Inequality in India
- Despite a general improvement in overall economic indicators, the gap between India’s richest 1% and the bottom 10% is widening.
- However, most surveys fail to reflect this rising inequality due to two key limitations:
- Differential Non-Response: The richest sections of society are far less likely to respond to surveys, leading to underrepresentation.
- Sampling Bias: Standard survey methodologies rarely capture members of the top 1%, whose wealth significantly skews inequality data.
- Because of these issues, survey-based Gini Index values systematically underestimate inequality.
- To address this, researchers often integrate survey data with tax records, especially income tax data, to more accurately estimate the wealth of the top 1%.
- This approach is used in the World Inequality Database, which shows that inequality in India has increased sharply over the years, contradicting the government’s claims of being one of the most equal societies.
Problems with Gini Index
- The Gini Index, while widely used, has notable limitations in capturing the full scope of inequality.
- It is less sensitive to changes at the extreme ends — the very rich and very poor — and is more responsive to variations in the middle-income groups.
- This makes it an incomplete measure, especially in societies with stark disparities.
- Experts have, for decades, advocated for the use of additional indicators alongside the Gini to get a fuller picture of inequality.
- Nobel laureate Abhijit Banerjee has noted that while the Gini is hard to interpret, its global trend signals a rise in income inequality across all countries.
The Need for Broader Measures to Gauge Inequality
- To truly understand and address rising inequality, governments must move beyond consumption-based Gini indices.
- Relying solely on these can create a misleading picture of declining inequality, even when income and wealth disparities are actually growing.
- A comprehensive approach using income tax and wealth data is essential for accurately capturing inequality and crafting effective policy responses.
Source: IE
Last updated on February, 2026
→ UPSC Notification 2026 is now out on the official website at upsconline.nic.in.
→ UPSC IFoS Notification 2026 is now out on the official website at upsconline.nic.in.
→ UPSC Calendar 2026 has been released.
→ Check out the latest UPSC Syllabus 2026 here.
→ Join Vajiram & Ravi’s Interview Guidance Programme for expert help to crack your final UPSC stage.
→ UPSC Mains Result 2025 is now out.
→ UPSC Prelims 2026 will be conducted on 24th May, 2026 & UPSC Mains 2026 will be conducted on 21st August 2026.
→ The UPSC Selection Process is of 3 stages-Prelims, Mains and Interview.
→ Prepare effectively with Vajiram & Ravi’s UPSC Prelims Test Series 2026 featuring full-length mock tests, detailed solutions, and performance analysis.
→ Enroll in Vajiram & Ravi’s UPSC Mains Test Series 2026 for structured answer writing practice, expert evaluation, and exam-oriented feedback.
→ Join Vajiram & Ravi’s Best UPSC Mentorship Program for personalized guidance, strategy planning, and one-to-one support from experienced mentors.
→ UPSC Result 2024 is released with latest UPSC Marksheet 2024. Check Now!
→ UPSC Toppers List 2024 is released now. Shakti Dubey is UPSC AIR 1 2024 Topper.
→ Also check Best UPSC Coaching in India
Gini Index India Inequality FAQs
Q1. What is India’s Gini Index as per the government? +
Q2. Why is consumption-based Gini misleading?+
Q3. How does survey data fail to capture inequality?+
Q4. What do experts say about the Gini Index? +
Q5. What’s a better way to measure inequality? +
Tags: gini index india inequality mains articles upsc current affairs upsc mains current affairs


