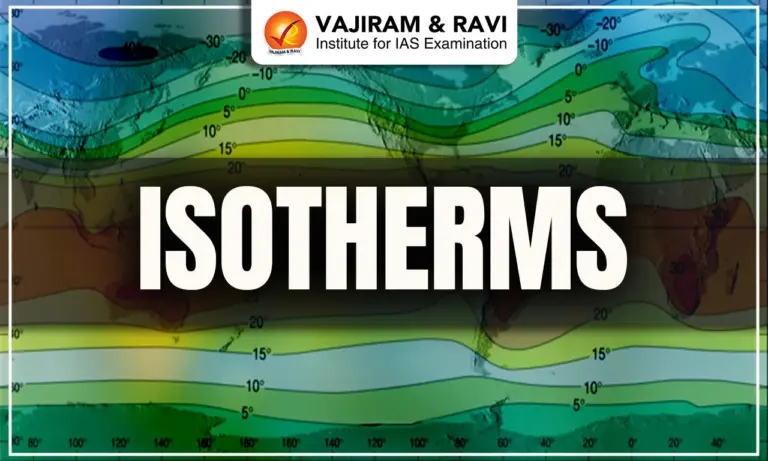
Isotherms are lines drawn on a map to connect places that share the same temperature at a specific time or over a given period. They help in visualising temperature distribution across regions. For instance, if a location in South America and another in Central Africa record the same temperature, they can be linked by an Isotherm on a world map. Such maps, called Isothermal Maps, make it easier to study climate patterns and temperature variations.
Isotherms Features
Isotherms are imaginary lines on a map that connect places with the same temperature. They help in understanding global temperature distribution, seasonal variations, and the influence of land, sea, and ocean currents.
| Isotherms Features | ||
|
Aspect |
Explanation |
Example/Note |
|
Definition |
Lines on a map connecting points of equal temperature. |
Used in Isothermal maps. |
|
General Pattern |
Usually run parallel to the equator. |
Show global temperature distribution. |
|
Temperature Variation |
Temperatures decrease from equator to poles. |
Equatorial regions are hottest. |
|
Spacing of Isotherms |
Close together – rapid temperature change; Far apart – gradual change. |
Seen in coastal vs. inland areas. |
|
Isotherms in January |
Move north over oceans (warmer seas), south over land (colder continents). |
Gulf Stream warms the N. Atlantic, bending Isotherms north; in Europe, they bend south. |
|
Specific Example |
At 60°E longitude in January, -20°C is observed at both 80°N and 50°N. |
Shows sharp temperature drop. |
|
Southern Hemisphere |
More parallel to latitude lines due to less landmass; shows gradual change. |
Contrast with the Northern Hemisphere. |
|
Isotherms in July |
20°C – 35°S, 10°C – 45°S, 0°C – 60°S. |
Generally follow latitude lines. |
Isotherms Temperature Distribution
The distribution of global temperatures is best understood through Isotherms, lines that connect areas with the same temperature. Since temperature is closely linked to latitude, Isotherms generally follow latitude lines. However, factors like land-sea contrast and ocean currents cause deviations. These deviations are more pronounced in January due to strong seasonal contrasts in the Northern Hemisphere, which has more landmass compared to the Southern Hemisphere.


Isotherms Lines
By studying temperature patterns in January and July, we can better understand the global distribution of heat. On maps, this distribution is shown with Isotherms, lines connecting places with the same temperature. Since temperature is strongly influenced by latitude, Isotherms usually run parallel to the latitude lines. This makes the effect of latitude on temperature clearly visible.
However, departures from this general pattern also occur. These deviations are more pronounced in January, especially in the Northern Hemisphere, than in July. The reason lies in the unequal distribution of land and water across the globe. The Northern Hemisphere has much more land area than the Southern Hemisphere, and this greater landmass, along with the influence of ocean currents, produces noticeable shifts in Isotherms.
Seasonal Temperature Distribution January
In January, the Northern Hemisphere is in winter, while the Southern Hemisphere experiences summer. The pattern of Isotherms reflects the contrast between land and sea, as well as the influence of winds and ocean currents.
Northern Hemisphere
- Ocean vs. Land Effect: Isotherms shift northward over the oceans and southward over the continents.
- Western Margins: Westerlies carry oceanic warmth inland, so the western margins of continents are warmer than the eastern sides.
- North Atlantic Influence: Warm currents like the Gulf Stream raise sea temperatures, bending Isotherms northward in the Atlantic.
- Continental Cold: Over northern landmasses, especially the Siberian Plain, Isotherms bend southward, reflecting extreme cold. Northern Siberia and Greenland record the lowest temperatures.
Southern Hemisphere
- Ocean Dominance: With less landmass, oceans exert greater control. Isotherms here are mostly parallel to latitudes, showing gradual temperature change.
- High-Temperature Belt: In January, a warm belt is located near 30°S latitude.
- Thermal Equator: The thermal equator shifts slightly south of the geographical equator, following the southward movement of the Sun and the ITCZ
Seasonal Temperature Distribution July
In July, the Northern Hemisphere is in summer, while the Southern Hemisphere experiences winter. The Isothermal behaviour is opposite to January. Overall, Isotherms run more parallel to latitudes, but land–ocean contrasts still influence their pattern.
General Features
- Equatorial Oceans: Temperatures exceed 27°C.
- Subtropical Asia (30°N belt): Land temperatures rise above 30°C, showing continental heating.
- Thermal Equator: Shifts north of the geographical equator, following the apparent northward movement of the Sun.
Northern Hemisphere
- Continental Heating: Overheated continents curve Isotherms northward, especially in Asia.
- Temperature Extremes: The largest range (>60°C) occurs in northeastern Eurasia due to its vast size.
- Minimal Range: Between 20°S and 15°N, the range narrows to about 3°C.
- Oceans vs. Continents: Isotherms bend southward over oceans, reflecting cooler waters that moderate nearby land.
- Hottest Regions: Northern Africa, West Asia, northwest India, and the southeastern USA.
- Coldest Zone: Greenland records the lowest July temperatures.
- Pattern: Highly irregular and zigzagging, due to strong land–ocean contrast.
Southern Hemisphere
- Steady Gradient: Isotherms are smoother and parallel to latitudes, with less variation because oceans dominate.
- Continental Effect: Slight bending of Isotherms toward the equator at continental edges.
- Thermal Equator: Lies north of the equator in July.
Vertical Distribution of Temperature
The normal lapse rate is the average rate at which air temperature decreases with increasing altitude in the troposphere. On average, it is about 6.5°C per 1,000 meters of ascent. This lapse rate remains fairly consistent at different heights within the troposphere.
- At the tropopause, the lapse rate stops, meaning the temperature no longer decreases with height but becomes almost constant.
- In the lower stratosphere, the lapse rate stays constant for some distance before temperature starts to rise again due to ozone absorption of solar radiation.
- Interestingly, temperatures in the lower stratosphere are relatively higher over the poles. This happens because the stratosphere is closer to Earth at the poles (lower height of tropopause), so heat exchange processes make polar stratospheric layers warmer compared to the equatorial regions at the same altitude.
Adsorption Isotherm
An Adsorption Isotherm is a graph that shows the relationship between the amount of a substance (adsorbate) that adheres to the surface of another material (adsorbent) at a constant temperature and the pressure of the adsorbate gas.
According to Le Chatelier’s principle, if the pressure of the adsorbate gas increases, the system adjusts by allowing more molecules to stick to the adsorbent surface, thereby reducing the number of free molecules in the gas phase.
However, the graph shows that beyond a certain point, called the saturation pressure, the adsorption curve levels off. This happens because the surface of the adsorbent has only a limited number of sites available. Once all of them are occupied, no additional molecules can stick, regardless of how much the pressure is increased.
Adsorption Isotherm Types
Over time, different scientists have proposed various models to explain adsorption isotherms. The most well-known include:
- Langmuir Isotherm – Explains adsorption on a uniform surface with a fixed number of identical sites.
- Freundlich Isotherm – An empirical model that describes adsorption on heterogeneous surfaces.
- BET Theory (Brunauer-Emmett-Teller) – Extends Langmuir’s model to multilayer adsorption, especially useful for studying surface area.
Since adsorption isotherms are part of Organic Chemistry, we won’t dive into detailed mathematical treatment here, to keep the concept simple and clear.
![]() Last updated on March, 2026
Last updated on March, 2026
→ UPSC Final Result 2025 is now out.
→ UPSC has released UPSC Toppers List 2025 with the Civil Services final result on its official website.
→ Anuj Agnihotri secured AIR 1 in the UPSC Civil Services Examination 2025.
→ UPSC Marksheet 2025 is now out.
→ UPSC Notification 2026 & UPSC IFoS Notification 2026 is now out on the official website at upsconline.nic.in.
→ UPSC Calendar 2026 has been released.
→ Check out the latest UPSC Syllabus 2026 here.
→ UPSC Prelims 2026 will be conducted on 24th May, 2026 & UPSC Mains 2026 will be conducted on 21st August 2026.
→ The UPSC Selection Process is of 3 stages-Prelims, Mains and Interview.
→ Prepare effectively with Vajiram & Ravi’s UPSC Prelims Test Series 2026 featuring full-length mock tests, detailed solutions, and performance analysis.
→ Enroll in Vajiram & Ravi’s UPSC Mains Test Series 2026 for structured answer writing practice, expert evaluation, and exam-oriented feedback.
→ Join Vajiram & Ravi’s Best UPSC Mentorship Program for personalized guidance, strategy planning, and one-to-one support from experienced mentors.
→ Shakti Dubey secures AIR 1 in UPSC CSE Exam 2024.
→ Also check Best UPSC Coaching in India
Isotherms FAQs
Q1. What is the definition of an isotherm?+
Q2. What is isotherm in geography?+
Q3. What are isotherms in UPSC?+
Q4. What are isobars and isotherms?+
Q5. What are the different types of isotherms?+
Tags: isotherms