

What’s in today’s article?
- Why in News?
- Exchange rate of Rupee
- Recording of Transactions
- About Current Account Balance
- India’s Current Account Deficit
- Major Highlights of the Data released by the Government
Why in News?
- As per the data released by the Ministry of Commerce and Industry recently, India’s imports in Financial Year 2023 (FY23) rose 16.5 per cent to $714 billion as against $613 billion in FY22 while exports saw a rise of 6% to $447 billion in FY23, up from $442 billion in FY22.
Exchange rate of Rupee
- Every day, Indians and Indian entities — such as firms and governments — import foreign goods and services, export domestic goods and services, receive investments from abroad, and make investments in other countries.
- Each of these transactions involves either a demand for foreign currency — for example, you need dollars to import something from the US or to invest in one of the US stock exchanges — or a demand for Indian currency (by the same logic).
- The interplay of these transactions decides the exchange rate of the Indian rupee vis-a-vis the foreign currency (say the US dollar).
Recording of Transactions
- A notebook, or slate or ledger that records all of the above mentioned transactions is called the Balance of Payment (BoP).
- The BoP has two parts –
- Capital Account:
- This includes all types of trading in capital.
- In other words, all investments inside and outside the country are recorded here — for example, if an Indian firm invests money in the US to build a new company there, or if an Indian buys stocks on an American exchange.
- Current Account:
- Here, all the trade in goods and services is noted down.
- For example, if an Indian imports an American gadget or software made by an American company or if an American entity imports Indian steel or engages an Indian IT company to create a software.
- The Current Account has two specific sub-parts:
- Import and Export of goods — this is the “trade account”.
- Import and export of services — this is called the “invisibles account”.
- Capital Account:


About Current Account Balance
- It is possible that a country — say India — imports more goods (everything from cars to phones to machinery to food grains etc.) than it exports.
- In such a case, it would have a “deficit” on its trade account.
- In other words, more money is going out of the country than coming in via the trade of physical goods.
- However, India could be enjoying a “surplus” on the invisibles account.
- This may happen because its software industry is very capable, efficient and competitive, and exports lots of software solutions.
- The net effect of this surplus (or deficit) on the invisibles account and the deficit (or surplus) on the trade account is called the current account balance.
India’s Current Account Deficit
- In case of India, there is a huge trade deficit and a smaller surplus on the invisibles hence what we have is an overall deficit on the current account — or Current Account Deficit.
- In essence, having a CAD or a deficit on the current account implies that, in monetary terms, India imports more goods and services than it exports.
- This, in turn, implies that the demand for the foreign currency (say the US dollar) is more than the demand for the Indian rupee.
- India’s CAD stood at $18.2 billion or 2.2 per cent of GDP in the quarter ended December 2022.
Major Highlights of the Data released by the Government
- Exports –
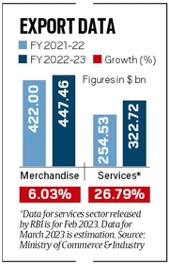
- Image Caption: Export Data for FY23
- Total goods exports in 2022-23 rose 6.03% to $447.46 billion.
- In comparison to goods exports, services exports are estimated to have grown by 26.79 per cent.
- Overall export of goods and services together scaled “new heights” and has increased by 14 per cent to $770 billion in 2022-23.
- India’s exports is largely led by petroleum ($94 billion), followed by electronic goods ($23 billion).
- The other three India’s top five export items registered insignificant growth – Rice (up 1.5%), chemicals (1%), and drugs and pharmaceuticals (0.8%).
- The USA remained India’s top export destination, followed by UAE.
- Imports –
- Overall imports are expected to have surged to $892.18 billion over the previous year.
- While petroleum imports jumped about 30% to nearly $210 billion in 2022-23, coal imports grew at a faster 57% to touch almost $50 billion.
- Gold imports, on the other hand, fell around 24% to $35 billion as global prices for the metal surged and the Rupee turned weaker.
Q1) What is Balance of Payment in Economics?
The balance of payments summarises the economic transactions of an economy with the rest of the world. These transactions include exports and imports of goods, services and financial assets, along with transfer payments (like foreign aid).
Q2) How much is India’s Trade Deficit with China?
India’s trade deficit stood at $101.02 billion for the calendar year of 2022, a sharp rise from the 2021 figure of $69.38 billion.
Source: Goods exports grew 6% , imports 16.5% this fiscal | Indian Express
Last updated on June, 2025
→ UPSC Notification 2025 was released on 22nd January 2025.
→ UPSC Prelims Result 2025 is out now for the CSE held on 25 May 2025.
→ UPSC Prelims Question Paper 2025 and Unofficial Prelims Answer Key 2025 are available now.
→ UPSC Calendar 2026 is released on 15th May, 2025.
→ The UPSC Vacancy 2025 were released 1129, out of which 979 were for UPSC CSE and remaining 150 are for UPSC IFoS.
→ UPSC Mains 2025 will be conducted on 22nd August 2025.
→ UPSC Prelims 2026 will be conducted on 24th May, 2026 & UPSC Mains 2026 will be conducted on 21st August 2026.
→ The UPSC Selection Process is of 3 stages-Prelims, Mains and Interview.
→ UPSC Result 2024 is released with latest UPSC Marksheet 2024. Check Now!
→ UPSC Toppers List 2024 is released now. Shakti Dubey is UPSC AIR 1 2024 Topper.
→ Also check Best IAS Coaching in Delhi