Ecological Pyramid, also known as energy or trophic pyramids, graphically represent the flow of energy, biomass, and number of organisms across different trophic levels in the ecosystem. They start with producers at the base and extend to top consumers at the apex. Types of ecological pyramids include the pyramid of numbers, the pyramid of biomass, and the pyramid of energy, which all illustrate the relationships between organisms in ecosystems and the inefficiency of energy transfer across trophic levels.
However, ecological pyramids have limitations, as they often ignore the complexity of food webs, exclude decomposers, and fail to account for seasonal variations and climate changes, offering only a simplified view of ecosystem dynamics.
Ecological Pyramid Meaning
Ecological Pyramid are graphical representations that illustrate the structure and function of ecosystems, highlighting the relationships between different trophic levels. First described by Charles Elton in the 1920s, these pyramids show the relative amounts of various ecological parameters, such as the number of organisms, energy, and biomass across different levels of the food chain.
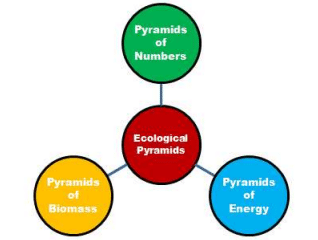
Ecological Pyramid Types
Ecological Pyramid are also known as trophic or energy pyramids, and they depict the flow of energy and the distribution of organisms, starting with producers at the base and extending through successive trophic levels to the apex. The following are the types of ecological pyramids:
- Pyramid of Numbers: It illustrates the number of individuals at each trophic level within a given area. It shows how the population size decreases as we move up the trophic levels, from producers at the bottom to top consumers.
- Pyramid of Biomass: It measures the total biomass (dry weight or caloric value) present at each trophic level. It provides insights into the total living material available at each level of the food chain in a given area.
- Pyramid of Energy: It measures the energy flow through each trophic level over time. It shows how energy decreases from one level to the next, as only a fraction of energy is transferred up the food chain. It is also referred to as a pyramid of productivity.


Ecological Pyramid of Numbers
The pyramid of numbers represents the number of individual organisms per unit area at each trophic level, starting with producers at the base and top carnivores at the apex. The shape of this pyramid can vary depending on the ecosystem and the distribution of organisms at each trophic level.
Upright Pyramid of Numbers
In the Upright Pyramid of Numbers, the number of individuals is decreased from a lower trophic level to a higher trophic level. The grassland, aquatic ecosystem and forest ecosystem exhibit this kind of pyramid.
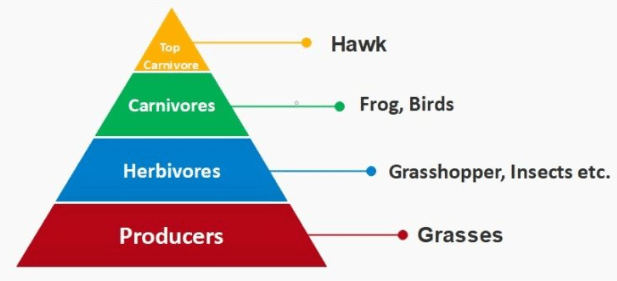
- Grassland Ecosystem: The number of organisms decreases at each higher trophic level, resulting in an upright pyramid.
- Producers: Grasses, which are small but large in number, form the broad base of the pyramid.
- Primary consumers: Insects, fewer in number than grasses.
- Secondary consumers: Frogs, birds, etc., with even fewer individuals.
- Top carnivores: Hawks, eagles, and foxes, the least in number.
- Aquatic Ecosystems: Similar to grasslands, the population decreases as trophic levels rise, forming an upright pyramid.
- Producers: Phytoplanktons (small but numerous).
- Primary consumers: Zooplanktons.
- Secondary consumers: Small fish.
- Top carnivores: Large fish, crocodiles.
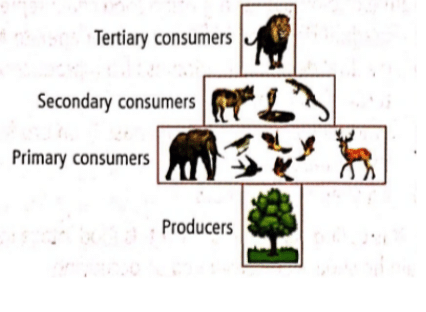
- Forest ecosystem: The population decreases at higher trophic levels, forming a spindle-shaped pyramid with a narrow base and apex and a broader middle.
- Producers: Large trees (few, forming a narrow base).
- Primary consumers: Insects, birds, and animals feeding on tree parts (larger in number, forming a broad middle).
- Secondary consumers: Predatory birds, foxes, and snakes (fewer in number than herbivores).
- Top carnivores: Lions, tigers (fewest in number, forming a narrow apex).
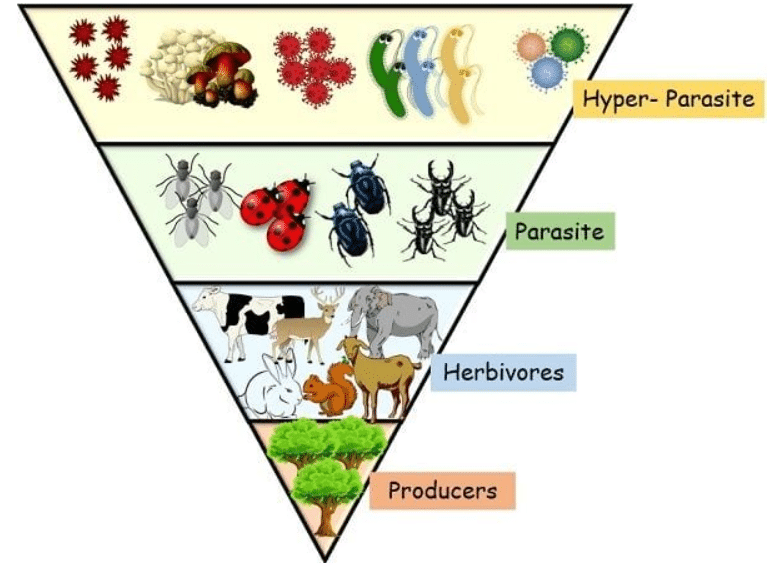
Inverted Pyramid of Numbers
In the Inverted Pyramid of Numbers, the number of individuals is increased from a lower level to a higher trophic level. Parasitic food chains exhibit this kind of pyramid.
- Parasitic food chain: The number of organisms increases at higher trophic levels, forming an inverted pyramid.
- Producers: Large trees (few).
- Primary consumers: Frugivorous birds (larger in number than trees).
- Secondary consumers: Ectoparasites like lice and bugs (more numerous than birds).
- Tertiary consumers: Hyperparasites like bugs, fleas, and microbes (the most numerous).
Ecological Pyramid of Biomass
A pyramid of biomass graphically represents the relationship between biomass and trophic levels by showing the total amount of living organic matter present at each level in a given area at a specific time. The shape of the pyramid can be upright or inverted, depending on the ecosystem.
Upright Pyramid of Biomass (Terrestrial Ecosystem)
In a forest, primary producers like plants and trees have the most biomass, forming the broad base of the pyramid. As trophic levels rise from herbivores to carnivores and top carnivores, the biomass decreases, creating a narrow top.
Inverted Pyramid of Biomass (Aquatic Ecosystem)
In a pond ecosystem, the primary producers (phytoplankton) have less biomass than the consumers (such as fish and insects). This results in an inverted pyramid, where the top consumers have more biomass than the producers.
<<Alt-text: Pyramid of Biomass in a Forest Ecosystem (Upright) b) Pyramid of Biomass in a Pond Ecosystem (Inverted)>>
Reference Image:https://edukemy.com/blog/ecological-pyramid-types-and-limitations-upsc-environment-notes/
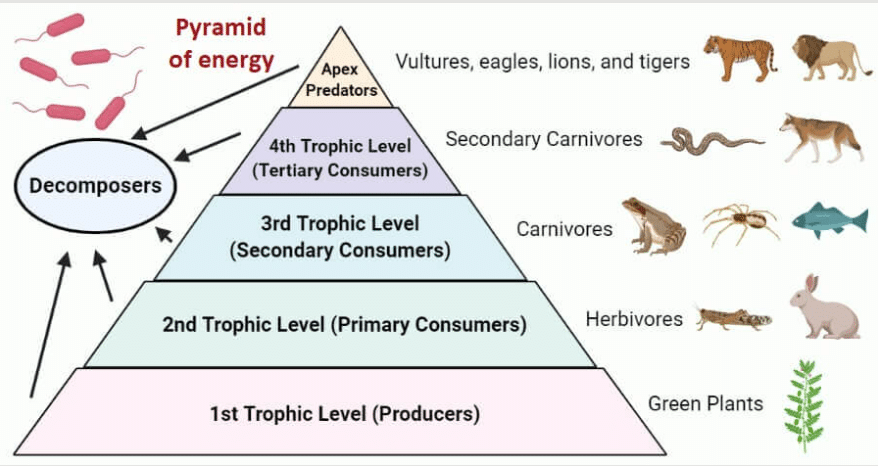
Ecological Pyramid of Energy
The pyramid of energy is the most practical of the three ecological pyramids, showing the functional relationship between trophic levels by representing the energy available at each level.
- It begins with producers at the base and moves up to consumers at higher trophic levels, also known as the pyramid of productivity.
- The energy flow in this pyramid is always upright for all ecosystems, reflecting the decrease in energy as it moves up the trophic levels.
Pyramid of Energy Advantages
The pyramid of energy illustrates the flow of energy through different trophic levels in an ecosystem over time. It provides a reliable way to compare energy content across species and ecosystems, regardless of organism size or population. These are explained below in detail:
- Measures energy flow: It shows how much energy is passed through each trophic level over a certain time, giving a clear picture of the energy available at each level.
- Energy constancy: Unlike pyramids of numbers and biomass, the shape of the energy pyramid stays the same no matter how large or small the organisms are or how many there are.
- Energy efficiency: It provides a more accurate way to compare different species based on energy content, even if they have similar weights or sizes.
- Ecosystem comparison: The pyramid of energy can be used to compare energy flow in different ecosystems, making it a useful tool for understanding energy use in various environment.
Pyramid of Energy Disadvantages
Energy flow measurement in ecosystems is challenging due to the complexity of tracking growth and reproduction over time. These are explained below in detail:
- Energy Flow Measurement: Calculating energy flow requires tracking the growth and reproduction of organisms over time, making the process complex and time-consuming.
- Trophic Level Assignment: Many organisms feed at different levels of the food chain, making it difficult to assign them to a single trophic level in the pyramid.
- Decomposer Placement: Decomposers, like fungi and bacteria, don’t fit into the traditional trophic levels of the pyramid, making it hard to represent them accurately in the energy pyramid model.
Ecological Pyramid Significance
An ecological pyramid helps us understand feeding patterns and energy flow in ecosystems, highlighting the inefficiency of energy transfer between trophic levels. The significance of ecological pyramids includes:
- Insight into Energy Transfer: The pyramid reveals the inefficiency of energy transfer across trophic levels.
- Trophic Level Influence: This shows how changes in population size at one level affect the levels above and below.
- Environmental Impact Studies: Long-term data collection allows studying how environmental changes (e.g., pollution, overhunting) affect organisms.
- Ecosystem Health: Helps monitor ecosystem health and take action if conditions worsen, offering insights into reversing damage.
Ecological Pyramid Limitations
Ecological pyramids have limitations in representing the full complexity of ecosystems, as they primarily focus on simple food chains. They often exclude key factors like food web interactions, decomposers, and environmental changes like seasons or climate variations. It has the following limitations:
- Ignores Food Web Complexity: The pyramid focuses only on simple food chains, failing to represent the complexity of natural food webs where species may span multiple trophic levels.
- Excludes Saprophytes: Decomposers, such as saprophytes, are not included in the ecological pyramid despite their essential role in nutrient recycling within ecosystems.
- Limited to Simple Food Chains: It is primarily useful for basic food chains and may not effectively capture the intricacies and interactions of more complex ecosystems.
- No Seasonal Insights: The ecological pyramid does not account for seasonal variations or climate changes, limiting its ability to reflect dynamic environmental conditions.
![]() Last updated on March, 2026
Last updated on March, 2026
→ UPSC Final Result 2025 is now out.
→ UPSC has released UPSC Toppers List 2025 with the Civil Services final result on its official website.
→ Anuj Agnihotri secured AIR 1 in the UPSC Civil Services Examination 2025.
→ UPSC Marksheet 2025 is now out.
→ UPSC Notification 2026 & UPSC IFoS Notification 2026 is now out on the official website at upsconline.nic.in.
→ UPSC Calendar 2026 has been released.
→ Check out the latest UPSC Syllabus 2026 here.
→ UPSC Prelims 2026 will be conducted on 24th May, 2026 & UPSC Mains 2026 will be conducted on 21st August 2026.
→ The UPSC Selection Process is of 3 stages-Prelims, Mains and Interview.
→ Prepare effectively with Vajiram & Ravi’s UPSC Prelims Test Series 2026 featuring full-length mock tests, detailed solutions, and performance analysis.
→ Enroll in Vajiram & Ravi’s UPSC Mains Test Series 2026 for structured answer writing practice, expert evaluation, and exam-oriented feedback.
→ Join Vajiram & Ravi’s Best UPSC Mentorship Program for personalized guidance, strategy planning, and one-to-one support from experienced mentors.
→ Shakti Dubey secures AIR 1 in UPSC CSE Exam 2024.
→ Also check Best UPSC Coaching in India
Ecological Pyramid FAQs
Q1. What are the three types of ecological pyramids?+
Q2. What are the 4 levels of the ecological pyramid?+
Q3. Who gave the concept of ecological pyramid?+
Q4. What are two examples of ecological pyramids?+
Q5. What is the 10% rule?+
Tags: ecological pyramid quest UPSC Environment and Ecology Notes