The oceans cover about 71% of the Earth’s surface, and most of their water is salty. The Salinity of Ocean Water refers to the concentration of dissolved salts in seawater. It is a crucial factor that influences ocean circulation, marine ecosystems, and global climate patterns. Salinity reflects the balance between processes that remove water, such as evaporation, and those that add water, such as precipitation, river inflow, and melting ice.
What is the Salinity of Ocean Water?
Salinity is defined as the total amount of dissolved salts present in seawater. It is usually expressed in parts per thousand (ppt), which indicates grams of salt per kilogram of seawater.
- Average Salinity: The average salinity of seawater is approximately 35 ppt, meaning 35 grams of dissolved salts are present per 1 kilogram of seawater.
- Brackish Water Threshold: Salinity above 24.7 ppt is considered not freshwater but lower than seawater.
- Composition of Seawater: The majority of the salts in seawater are sodium chloride (NaCl), making up around 77.7% of the total salts. Other important salts include magnesium chloride (10.9%), magnesium sulfate (4.7%), calcium sulfate (3.6%), and potassium sulfate (2.5%).
Factors Affecting Salinity of Ocean Water
Salinity is not uniform across the oceans. Various natural processes influence the concentration of salts in seawater:
- Evaporation and Precipitation:
-
- High rates of evaporation remove water while leaving salts behind, increasing salinity.
- Conversely, heavy rainfall dilutes seawater, reducing salinity.
- Examples: The Red Sea and Mediterranean Sea have high salinity due to intense evaporation.
- River Inflow and Freshwater Input:
- Freshwater from rivers and melting ice reduces the salinity of seawater.
- Examples: The Bay of Bengal shows low salinity because of the inflow from the Ganges–Brahmaputra river system.
- Freezing and Melting of Ice:
- When sea ice forms, salt is left behind in the surrounding water, increasing salinity.
- Melting ice adds freshwater, reducing salinity in polar regions.
- Ocean Currents and Wind:
- Currents redistribute water with different salinity levels.
- Warm currents can raise salinity in higher latitudes, while cold currents may reduce it in tropical regions.
- Example: The North Sea has higher salinity due to the inflow of saline water from the North Atlantic Drift.
- Temperature and Density:
- Warmer water promotes evaporation, increasing salinity, while colder water slows evaporation, decreasing it.
- Changes in water density due to temperature also influence vertical mixing and the distribution of salinity.
- Limited Water Mixing:
- Enclosed or land-locked seas with minimal freshwater inflow tend to have high salinity.
- Examples: Red Sea, Persian Gulf, and Caspian Sea.
Extremely high salinity examples:
- Lake Van in Turkey: ~330 ppt
- Dead Sea: ~238 ppt
- Great Salt Lake: ~220 ppt


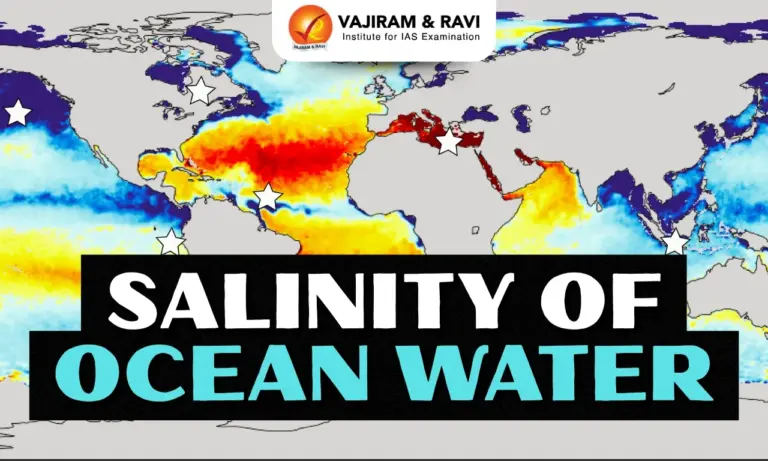
Horizontal Distribution of Salinity of Ocean Water
The Horizontal Distribution of Salinity of Ocean Water refers to variations across different regions of the oceans. The salinity of the open ocean ranges between 33 and 37 ppt.
- Equatorial Regions: Salinity is moderate. While evaporation is high, it is often balanced by heavy rainfall.
- Subtropical High-pressure Zones: These regions (around 20°–30° latitude) experience the highest salinity due to high evaporation and low precipitation.
- Polar Regions and Mid-latitudes: Surface salinity is low due to freshwater input from melting ice and rivers.
Examples of Regional Variations:
- Atlantic Ocean: Generally higher salinity (~36 ppt) compared to the Pacific.
- Pacific Ocean: Slightly lower salinity (35–31 ppt) due to higher freshwater input.
- Indian Ocean: Average salinity ~35 ppt; the Arabian Sea has higher salinity due to evaporation, whereas the Bay of Bengal has lower salinity due to river inflow.
- Red Sea: Very high salinity because it is landlocked and evaporation is high.
- Black Sea / Baltic Sea: Low salinity due to large freshwater inflow from rivers.
- Mediterranean Sea: High salinity due to high evaporation and limited freshwater input.
Vertical Distribution of Salinity of Ocean Water
Salinity varies with ocean depth, forming distinct layers that influence water density and mixing. The surface water, halocline, and deep water show different salinity characteristics depending on latitude and regional factors.
- Surface Layer: Salinity changes due to evaporation, precipitation, and freshwater inflow.
- Halocline: A zone where salinity increases sharply with depth.
- Deep Water: Salinity becomes relatively uniform due to minimal mixing.
- High Latitudes: Salinity generally increases with depth.
- Mid-Latitudes: Salinity increases up to a certain depth (~35 m), then slightly decreases.
- Equatorial Regions: Surface salinity is lower due to high precipitation and cloudiness; moderate increase occurs at depth.
Salinity of Ocean Water Significance
Salinity plays a crucial role in regulating ocean circulation, marine ecosystems, and climate. It affects water density, ocean currents, and the physical and chemical properties of seawater.
- Drives Ocean Circulation: Salinity, along with temperature, determines water density, powering thermohaline circulation.
- Supports Marine Life: Many organisms are adapted to specific salinity ranges; sudden changes can impact biodiversity.
- Influences Climate: Salinity affects ocean currents that distribute heat globally, impacting weather patterns.
- Affects Water Properties: Determines freezing point, boiling point, and conductivity of seawater.
- Important for Oceanography: Salinity measurements help track water movement, nutrient distribution, and climate change effects.
![]() Last updated on March, 2026
Last updated on March, 2026
→ UPSC Final Result 2025 is now out.
→ UPSC has released UPSC Toppers List 2025 with the Civil Services final result on its official website.
→ Anuj Agnihotri secured AIR 1 in the UPSC Civil Services Examination 2025.
→ UPSC Marksheet 2025 is now out.
→ UPSC Notification 2026 & UPSC IFoS Notification 2026 is now out on the official website at upsconline.nic.in.
→ UPSC Calendar 2026 has been released.
→ Check out the latest UPSC Syllabus 2026 here.
→ UPSC Prelims 2026 will be conducted on 24th May, 2026 & UPSC Mains 2026 will be conducted on 21st August 2026.
→ The UPSC Selection Process is of 3 stages-Prelims, Mains and Interview.
→ Prepare effectively with Vajiram & Ravi’s UPSC Prelims Test Series 2026 featuring full-length mock tests, detailed solutions, and performance analysis.
→ Enroll in Vajiram & Ravi’s UPSC Mains Test Series 2026 for structured answer writing practice, expert evaluation, and exam-oriented feedback.
→ Join Vajiram & Ravi’s Best UPSC Mentorship Program for personalized guidance, strategy planning, and one-to-one support from experienced mentors.
→ Shakti Dubey secures AIR 1 in UPSC CSE Exam 2024.
→ Also check Best UPSC Coaching in India
Salinity of Ocean Water FAQs
Q1. What is salinity?+
Q2. What is the average salinity of ocean water?+
Q3. Which regions have the highest salinity?+
Q4. Which regions have low salinity?+
Q5. What is a halocline?+
Tags: salinity of ocean water