What is poverty?
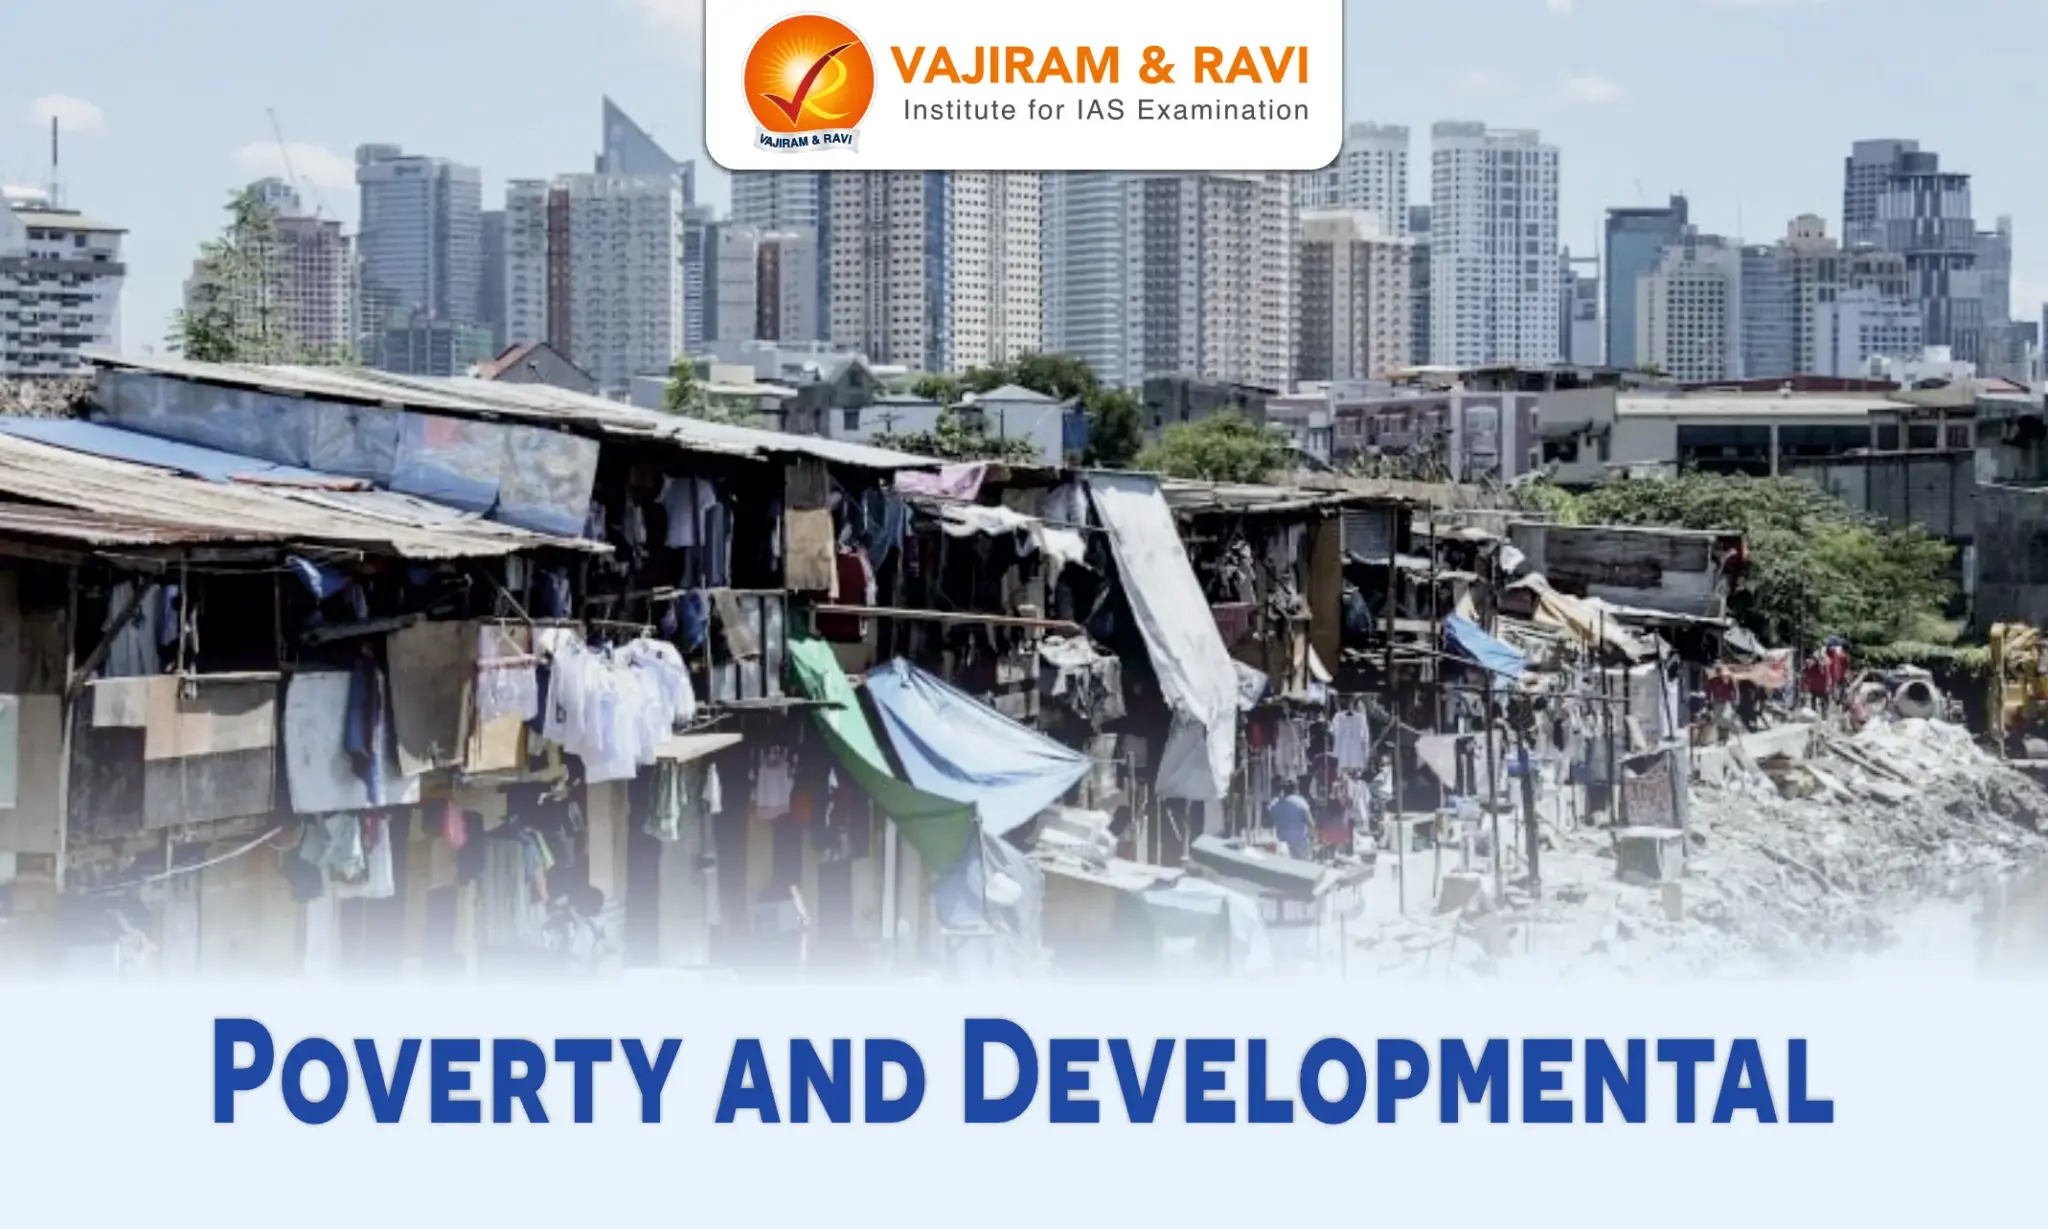
Poverty is a state or condition in which an individual or group lacks the resources necessary to meet basic needs and enjoy a decent standard of living. These basic needs include food, shelter, clothing, healthcare, and education.
Poverty can also mean lacking access to basic amenities such as clean water, sanitation facilities, and electricity.
Status of poverty in India
- Global MPI 2022: 415 million individuals in India were able to escape multidimensional poverty in the last 15 years between 2005–2006 and 2019–21, with the incidence of poverty exhibiting a sharp drop from 55.1% to 16.4%.
- MPI report by NITI Aayog, 2021: National MPI score of India is 0.118. In India, 25.01% of the population was multidimensionally poor.
- Kerala has turned out to be the state with the lowest rate of poverty in India. (only 0.71% of Kerala’s population is poor).
- Kottayam of Kerala is the only district in India without poverty.
- Bihar, Jharkhand, and Uttar Pradesh have registered the highest poverty rate across India.
- 51.91% of the population in Bihar is classified as poor, followed by Jharkhand (42.16%) and Uttar Pradesh (37.79%).
What are the various outcomes of poverty?
Some of the important outcomes of poverty include
- Lack of access to basic necessities: People living in poverty often lack access to basic necessities such as food, water, shelter, and healthcare.
- Poor health: Poverty is associated with poor health outcomes, including malnutrition, higher rates of disease and illness, and limited access to medical care.
- Poor education: Poverty often leads to poor educational outcomes, with individuals from low-income households having limited access to quality education and training.
- Limited job opportunities: Poverty can limit job opportunities, with individuals from low-income households often facing discrimination and limited access to employment opportunities.
- Housing insecurity: Individuals living in poverty may struggle to afford adequate housing, with many living in overcrowded or substandard housing conditions.
- Social exclusion: Poverty can lead to social exclusion, with individuals from low-income households facing discrimination and stigma.
What is poverty line?
The minimum expenditure (or income) required to purchase a basket of goods and services necessary to satisfy basic human needs is called the poverty line.
- Poverty line estimation in India has been based on the consumption expenditure and not on the income levels due to difficulties in assessing incomes rural and informal economy of India.
- The basket of goods and services necessary to satisfy basic human needs is the Poverty Line Basket (PLB).
Limitations of poverty line estimation
However, the poverty line approach also has several limitations
- Inadequate measurement: It is based on a consumption-based approach, hence may not capture all aspects of poverty, such as access to healthcare, education, and other social services.
- PLB components: Determining components of PLB has been one of the challenges due to price differentials (of constituents of basket) which vary from state to state and period to period.
- Limited coverage: It only covers those households who fall below the poverty line, leaving out households who are just above the poverty line but still face significant challenges in meeting their basic needs.
- Lack of regional variation: Since it is based on a national average, which may not reflect the differences in the cost of living and poverty levels across different regions in India.
- Lack of consideration for vulnerability: It does not take into account vulnerable groups, such as women, children, and the elderly, who may face additional challenges in meeting their basic needs.
How has poverty estimation evolved in India?
Poverty estimation in India has evolved in the following ways:
- In the pre-independent era, Dadabhai Naoroji, in his “Poverty and the Un-British Rule in India” was among the first to estimate poverty in India linked to British rule.
- Later, the National Planning Committee(1938) and the Bombay Plan(1944) formulated their respective poverty lines.
- The Alagh Committee(1979) developed a poverty line for rural and urban areas based on nutritional requirements. Also, DT Lakdawala (1993) suggested calculating consumption expenditure based on calorie consumption and constructing state-specific poverty lines that could be regularly updated.
- Tendulkar Committee (2009): The Tendulkar Committee recommended changing monthly household consumption into consumption expenditure per person per day.
- The national poverty line for 2011-12 was estimated at Rs. 816 per capita per month for rural areas and Rs. 1,000 per capita per month for urban areas
- Rangarajan Committee (2014): It recommended separate consumption baskets for rural and urban areas which include food items that ensure recommended calorie, protein & fat intake and non-food items like clothing, education, health, housing and transport.
- It recommended monthly per capita consumption expenditure of Rs. 972 in rural areas and Rs. 1407 in urban areas as the poverty line
- Socio-Economic Caste Survey (SECC), 2011: It was based on the committee chaired by Dr. N. C. Saxena to propose a new methodology for identifying below poverty line households. The committee recommended a three-fold classification of households: Automatically excluded, Automatically included and Others
- Government has also being using SECC data for identification of beneficiary households while implementing its social welfare programmes
- Currently, poverty estimation in India is carried out by NITI Aayog Task force. It uses data collected by the National Sample Survey Office (Ministry of Statistics and Programme Implementation (MOSPI)) to calculate the poverty line.
What are the various indices to measure poverty?
Global Indicators
Some of the indices used to measure poverty are:
- Global Multidimensional Poverty Index (MPI): It is released by the United Nations Development Programme (UNDP) and the Oxford Poverty and Human Development Initiative (OPHI).
- MPI integrates two factors of poverty
- Incidence of poverty: It is the percentage of people who are poor. This is the headcount ratio of multidimensional poverty (H).
- Intensity of poverty: It takes into account the average percentage of dimensions in which poor people are deprived(A).
- The MPI is calculated by multiplying the poverty headcount by the intensity of poverty, MPI = H x A (Incidence x Intensity).
- Global MPI 2022: India has the largest number of poor worldwide at 22.8 crore. Also, the incidence of poverty has fallen from 55% in 2005/06 to 16.4% in 2019/21 in India.
- MPI integrates two factors of poverty
| Dimensions(Weightage) | Indicators(Weightage) |
| Health (⅓) |
|
| Education (⅓) |
|
| Standard of Living (⅓) |
|
- World Bank Poverty Line: At the international level the World Bank has set the international poverty line at $2.15 per person per day using 2017 prices.
- Poverty Gap Index: Developed by the World Bank. It measures the intensity of poverty by calculating the amount of money required by a poor household in order to reach the poverty line.
- Poverty and Shared Prosperity Report, 2022: It is released by the World Bank. According to it, in 2020 alone, the number of people living below the extreme poverty line rose by over 70 million
National Indicators
- National Multidimensional Poverty Index: It is released by NITI Aayog. The baseline report is based on the National Family Health Survey 4, which was conducted in 2015-16.
- Bihar: Highest proportion of people multidimensionally poor
- Kerala: Lowest proportion of people multidimensionally poor
| Dimensions (Weightage) | Indicators(Weightage) |
| Health (⅓) |
|
| Education (⅓) |
|
| Standard of Living (⅓) |
|
- Bare necessities Index (BNI): It is constructed by Economic Survey 2020-2021 using data from National Statistics Office (NSO). It aims to quantify the basic needs approach to economic development.
- The BNI summarizes 26 indicators on five dimensions, viz., water, sanitation, housing, micro-environment, and other facilities.
What are the various government initiatives to alleviate poverty in India?
The Poverty Alleviation Programme intends to reduce the rate of poverty in the country by providing proper access to food, monetary help, and basic amenities to households belonging to below the poverty line.
The following are some of the anti-poverty initiatives by the government:
- Employment Related
- Integrated Rural Development Programme (IRDP):
- Mahatma Gandhi National Rural Employment Guarantee Act, 2005 (MGNREGA)
- National livelihoods mission
- Pradhan Mantri Kaushal Vikas Yojana
- Food Related
- National Food Security Act, 2013
- Antyodaya Anna Yojana
- Incentives Related
- Pradhan Mantri Awaas Yojana (PMGY)
- Pradhan Mantri Jan-Dhan Yojana (PMJDY) Additional text to be added here.
Last updated on April, 2025
→ UPSC Notification 2025 was released on 22nd January 2025.
→ UPSC Calendar 2026 is released on 15th May, 2025.
→ The UPSC Vacancy 2025 were released 1129, out of which 979 were for UPSC CSE and remaining 150 are for UPSC IFoS.
→ UPSC Admit Card 2025 is released now for CSE Prelims Exam 2025.
→ The UPSC Prelims 2025 is scheduled to be conducted on 25th May 2025 and UPSC Mains 2025 will be conducted on 22nd August 2025.
→ Apply once through it and aspirants can apply for various government exams conducted by UPSC.
→ The UPSC Selection Process is of 3 stages-Prelims, Mains and Interview.
→ UPSC Result 2024 is released with latest UPSC Marksheet 2024. Check Now!
→ UPSC Toppers List 2024 is released now. Shakti Dubey is UPSC AIR 1 2024 Topper.
→ Also check Best IAS Coaching in Delhi
Issues Relating to Poverty in India FAQs
Q1. What is headcount ratio?+
Q2. What is below poverty line (BPL) and above poverty line (APL)?+


