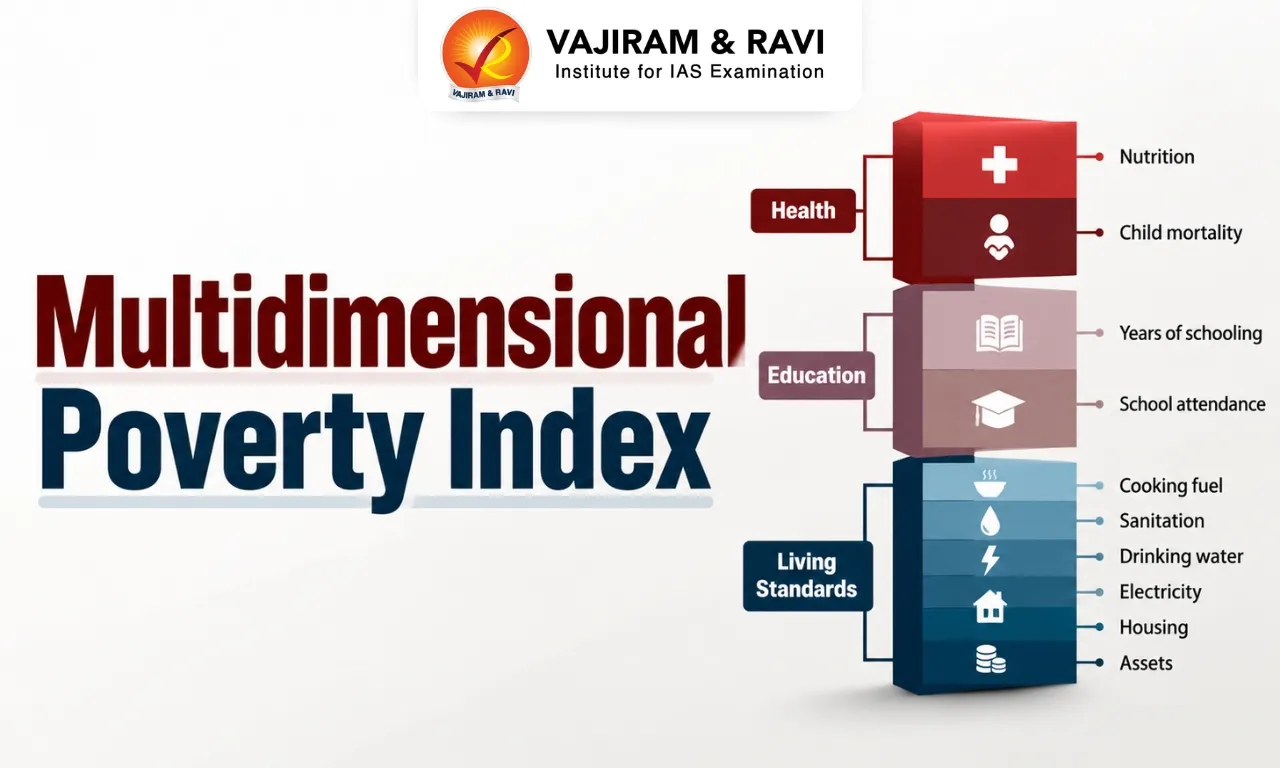
The Multidimensional Poverty Index (MPI) measures poverty beyond income by identifying overlapping deprivations in health, education and living standards. The Global Multidimensional Poverty Index 2026, released by the United Nations Development Programme (UNDP) and the Oxford Poverty and Human Development Initiative (OPHI), presents estimates for 108 developing countries.
The Multidimensional Poverty Index reports that approximately 1.2 billion people across these countries experience acute multidimensional poverty. India’s latest MPI estimate in this release is based on household survey data from 2019–2021, not data collected in 2026. The index helps policymakers identify the nature of deprivation and design targeted interventions to improve people’s living conditions.
Multidimensional Poverty Index (MPI) Meaning
The Multidimensional Poverty Index is a measure of acute poverty that identifies people experiencing multiple, overlapping disadvantages in essential areas of human development rather than relying solely on income.
- The global MPI was introduced in the 2010 Human Development Report. Since 2018, the Human Development Report Office (HDRO) and OPHI have jointly produced and published its estimates.
- Unlike monetary poverty measures, which focus on whether people’s income or consumption falls below a specified poverty line, the MPI examines whether people face simultaneous deprivations in health, education and standard of living.
- The index helps governments and development institutions understand not only how many people are poor but also the intensity and composition of their deprivation. It complements income-based poverty measures and supports evidence-based policymaking.
Multidimensional Poverty Index (MPI) Calculation
The Multidimensional Poverty Index (MPI) is calculated using the Alkire–Foster methodology, which identifies people experiencing overlapping deprivations across health, education and standard of living.
- The methodology involves identifying the specific disadvantages faced by each person, assigning weights to the indicators, and calculating a deprivation score for each household.
- People with a weighted deprivation score of at least one-third are classified as multidimensionally poor under the global MPI framework.
|
MPI = H × A
|
- For example, if 20% of a population is multidimensionally poor and the average intensity of their deprivation is 40%, the MPI is 0.080.
- A higher MPI value indicates greater multidimensional poverty. The index ranges from 0 to 1.


Multidimensional Poverty Index Objectives
The MPI aims to provide a more comprehensive understanding of poverty by identifying the specific disadvantages that prevent people from achieving adequate living standards and human development. Its major objectives include:
- Measuring poverty beyond income: Identifies deprivation in health, education and living standards, even when income-based measures do not classify a person as poor.
- Identifying overlapping disadvantages: Recognises that a household may simultaneously experience inadequate nutrition, limited education and poor housing.
- Supporting targeted policymaking: Helps governments identify which dimensions contribute most to poverty and direct resources accordingly.
- Monitoring development progress: Enables countries to assess changes in multidimensional poverty over time where comparable survey data are available.
- Supporting the Sustainable Development Goals: Contributes to monitoring SDG 1, particularly Target 1.2, which calls for reducing poverty in all its forms and dimensions.
- Highlighting vulnerable groups: Helps analyse poverty across population groups and geographical areas, including rural and urban communities.
- Improving accountability: Provides a measurable framework for evaluating whether development interventions are reducing deprivation.
Multidimensional Poverty Index Indicators
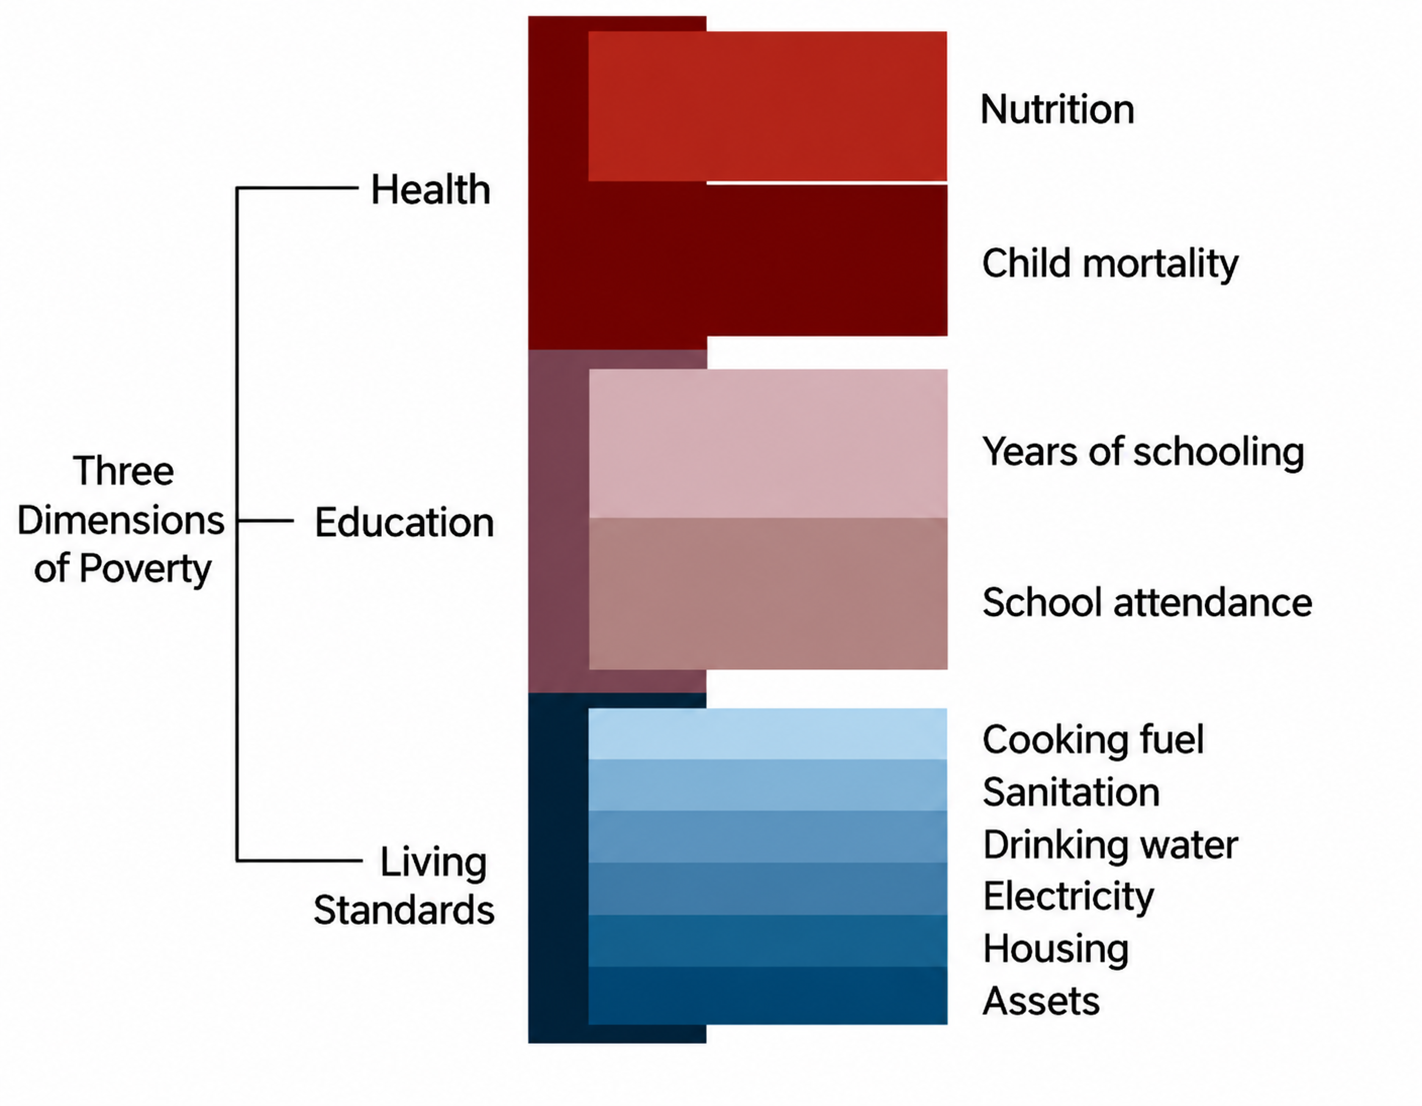
The global Multidimensional Poverty Index uses 10 indicators across three equally weighted dimensions – health, education and standard of living – to identify overlapping deprivation within households. The three dimensions carry equal overall weight, while each individual indicator receives a specific weight within its dimension. The indicators are calculated using data from the same household survey for each country.
- Health: Health accounts for one-third of the overall MPI weight and includes two indicators.
- Nutrition: A household is considered deprived when a person covered by the indicator’s definition is undernourished.
- Child mortality: A household is deprived if a child under 18 has died in the family during the five years preceding the survey.
- Each health indicator carries a weight of 1/6.
- Education: Education also accounts for one-third of the overall MPI weight and measures access to schooling and educational attainment.
- Years of schooling: A household is deprived if no eligible household member has completed at least six years of schooling.
- School attendance: A household is deprived if a school-aged child is not attending school up to the age at which they would complete class eight.
- Each education indicator carries a weight of 1/6.
- Standard of Living: Standard of living accounts for one-third of the MPI weight and includes six indicators.
- Cooking fuel: Deprivation occurs when a household cooks using fuels such as dung, wood, charcoal or coal.
- Sanitation: A household is deprived if its sanitation facility is unimproved or an improved facility is shared with other households.
- Drinking water: Deprivation occurs when the household lacks improved drinking water or must travel at least 30 minutes for a round trip to obtain it.
- Electricity: A household is deprived if it has no electricity.
- Housing: Deprivation occurs when housing materials are inadequate, including natural flooring or rudimentary roof or wall materials.
- Assets: A household is deprived if it lacks more than one specified asset and does not own a car or truck.
- Each standard-of-living indicator carries a weight of 1/18.
Multidimensional Poverty Index Poverty Classification
The global MPI classifies people according to their weighted deprivation scores.
- Multidimensionally poor: Deprivation score of one-third or more.
- Vulnerable to multidimensional poverty: Deprivation score of at least one-fifth but below one-third.
- Severe multidimensional poverty: Deprivation score of one-half or more.
Multidimensional Poverty Index 2026 Key Findings
The 2026 global Multidimensional Poverty Index update highlights the continuing scale of multidimensional poverty, its disproportionate impact on children and rural populations, and the possibility of reducing deprivation through sustained policy action. According to UNDP’s 2026 report,
- 108 developing countries are covered by the global MPI.
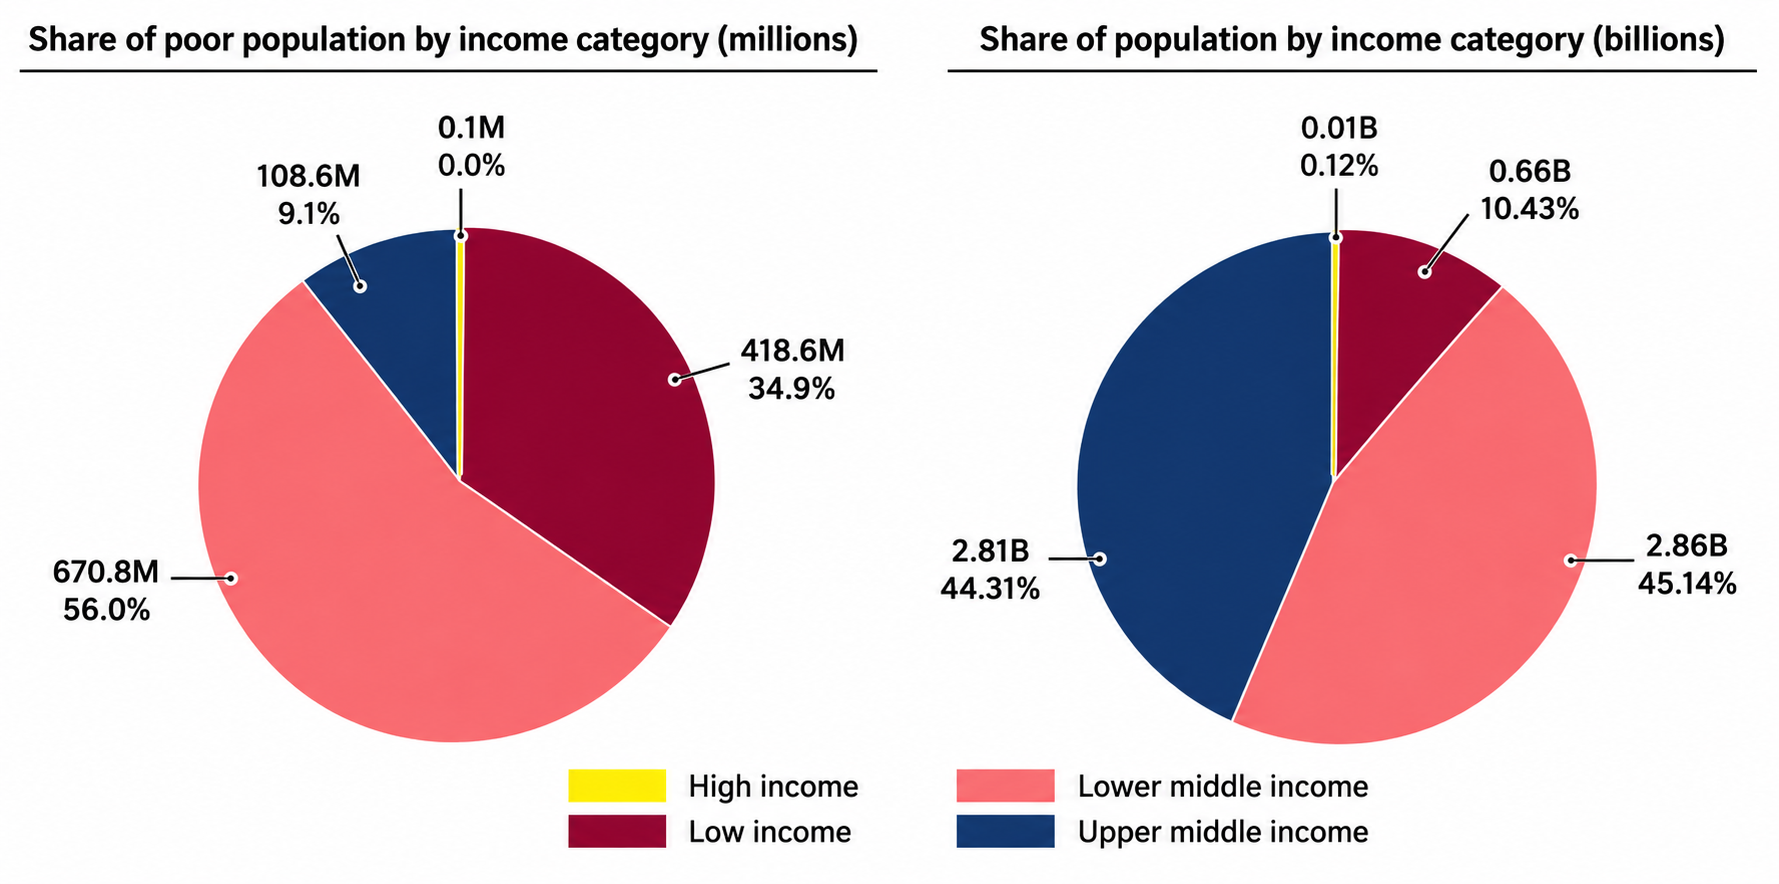
- Approximately 1.2 billion people, or 18.9% of the combined population of 6.3 billion across the countries covered, live in acute multidimensional poverty.
- Around 617 million poor people are children, representing 51.5% of the global multidimensionally poor population.
- More than eight in ten multidimensionally poor people live in rural areas.
- Sub-Saharan Africa has approximately 616 million multidimensionally poor people, representing 51.4% of its population.
- Among 89 countries with MPI trend data, 33 have reduced their MPI value by half in fewer than 15 years.
- Global multidimensional poverty has increased for the first time since 2010.
Multidimensional Poverty Index 2026 India Findings
India’s MPI profile in the 2026 release shows that multidimensional poverty remains a significant development concern, while also highlighting the importance of examining deprivation across health, education and living standards.
- The India briefing uses the most recent publicly available household survey data for the global MPI calculation, which refers to 2019–2021.
- The year 2026 refers to the publication of the report, not the collection year of India’s underlying survey data.
India’s Multidimensional Poverty Index 2026 Score, Rank and Key Findings
India’s MPI value is 0.069, with a multidimensional poverty headcount of 16.4% and an intensity of deprivation of 42.0%. The 2026 global MPI tables do not assign countries a single ordinal MPI rank, so an official global rank should not be inferred from the score. The key findings for India are:
- Multidimensional Poverty Index value: 0.069.
- Multidimensional poverty headcount: 16.4%.
- Intensity of deprivation: 42.0%.
- Population vulnerable to multidimensional poverty: 18.7%.
- Population living in severe multidimensional poverty: 4.2%.
- Estimated multidimensionally poor population in 2024: approximately 237.85 million.
- Estimated population vulnerable to multidimensional poverty in 2024: approximately 271.14 million.
- Monetary poverty below the international PPP US$3-per-day line: 5.3%.
- The India briefing estimates that multidimensional poverty affects a larger share of the population than monetary poverty.
- Its headcount is 11.1 percentage points higher than the monetary poverty rate shown in the briefing. This demonstrates why income-based measures alone cannot capture all forms of deprivation.
Contribution of Different Dimensions to India’s MPI
The contribution of each dimension indicates its share in India’s overall multidimensional poverty, helping identify areas where policy interventions may have a substantial impact.
- Standard of living – 39.7%: This is the largest contribution to India’s MPI, highlighting the continuing importance of housing, sanitation, clean cooking fuel, drinking water, electricity and household assets.
- Health – 32.2%: Health-related deprivation remains a major contributor, including disadvantages reflected through nutrition and child mortality.
- Education – 28.2%: Educational deprivation contributes more than one-quarter of India’s MPI, underscoring the importance of schooling access and educational attainment.
India’s MPI Compared with Neighbouring Countries
- India and Bangladesh: Bangladesh’s MPI value is 0.067, slightly below India’s 0.069. Its multidimensional poverty headcount is also lower, at 14.9%, compared with India’s 16.4%.
- India and Pakistan: Pakistan records an MPI value of 0.198, substantially higher than India’s 0.069. Its multidimensional poverty headcount is 38.3%, compared with 16.4% in India.
- India and Bhutan: Bhutan’s MPI value is 0.039, lower than India’s 0.069. Its multidimensional poverty headcount is 9.8%, compared with India’s 16.4%.
- India and Sri Lanka: Sri Lanka’s MPI value is 0.011, with a multidimensional poverty headcount of 2.9% and an intensity of 38.3%.
Multidimensional Poverty Index and Challenges Associated with India
India’s MPI findings highlight persistent challenges in living standards, health and education, requiring coordinated interventions that address the root causes of deprivation across different communities.
- Deprivation in Living Standards: Standard of living contributes 39.7% to India’s overall Multidimensional Poverty Index, making it the largest contributing dimension in the 2026 country profile. Inadequate housing, sanitation, clean cooking fuel, drinking water and household assets can reinforce other forms of deprivation.
- Health and Nutrition Gaps: Health contributes 32.2% to India’s MPI. Undernutrition and child mortality are among the indicators used by the global Multidimensional Poverty Index to identify deprivation.
- Improving access to healthcare, nutrition services and maternal and child health support remains important for reducing multidimensional poverty.
- Educational Deprivation: Education contributes 28.2% to India’s overall MPI. Inadequate years of schooling and irregular school attendance can limit employment opportunities and reinforce intergenerational poverty.
- Improving school access, retention and learning outcomes is therefore essential.
- Rural–Urban and Regional Disparities: Poverty is not distributed evenly across geographical areas or population groups.
- Remote rural communities, underserved settlements and disadvantaged regions may face multiple barriers to public services, infrastructure and livelihood opportunities. National averages can conceal these local differences.
- Vulnerability to Falling Back into Poverty: The India profile classifies 18.7% of the population as vulnerable to the multidimensional poverty index. Households close to the poverty threshold may be at risk of experiencing additional deprivation when they face income loss, illness, natural disasters or rising essential expenses.
- Limitations of Income-Based Poverty Measures: India’s MPI headcount is 16.4%, while the monetary poverty figure shown in the 2026 briefing is 5.3% using the international PPP US$3-per-day line.
- The difference demonstrates that income measures alone may not capture deprivation in health, education and living standards.
- Data and Monitoring Challenges: Multidimensional Poverty Index estimates depend on household surveys that measure the required indicators together. Differences in survey years can complicate comparisons between countries and periods.
- Regular, reliable and disaggregated data are necessary to monitor progress and identify communities that continue to experience overlapping disadvantages.
Multidimensional Poverty Index Way Forward for India
Reducing multidimensional poverty requires integrated policies that improve essential services, strengthen livelihoods and use reliable data to identify households experiencing overlapping forms of deprivation.
- Strengthen Essential Public Services: Improve the reliability and quality of drinking water, sanitation, electricity, housing and clean cooking fuel services. Infrastructure programmes should focus not only on providing connections but also on ensuring sustained access, affordability and service quality.
- Improve Healthcare and Nutrition: Strengthen primary healthcare, maternal and child health services, nutrition interventions and early identification of undernutrition. Better coordination between healthcare providers, nutrition programmes and local administrations can help address health-related deprivation.
- Improve Educational Access and Learning: Prioritise school attendance, retention, foundational literacy and numeracy, and the completion of essential years of schooling. Targeted support for disadvantaged children can help reduce educational deprivation and its long-term effects.
- Use Disaggregated MPI Data: Analyse poverty by state, district, rural and urban location, age and other relevant characteristics wherever reliable data permit. Localised analysis can help authorities identify the particular indicators responsible for deprivation and design more targeted interventions.
- Promote Sustainable Livelihoods: Expand access to productive employment, skills development, rural livelihoods and opportunities for women. Stable incomes can improve households’ ability to invest in education, healthcare, nutrition and adequate housing, complementing direct public-service interventions.
Multidimensional Poverty Index UPSC PYQs
Q1. Consider the following statements about Multidimensional Poverty Index (MPI): (UPSC Prelims 2026)
- MPI is calculated using Alkire-Foster methodology.
- MPI calculated by NITI Aayog has a total of twelve indicators.
- Maternal Health and Bank Account are common indicators in the MPI of NITI Aayog and MPI of United Nations Development Programme (UNDP).
Which of the statements given above is/are correct?
(a) 1 and 2 only
(b) 1, 2 and 3
(c) 1 and 3 only
(d) 2 only
Ans: (a)

 Last updated on Oct, 2026
→ UPSC 2027 Notification will be released on 13 January 2027 at upsconline.nic.in.
→ Check Nobel Prize 2026 Winners List here.
→ Download PIB PRiSM Monthly Magazine 2026 here.
→ Check UPSC Monthly Current Affairs Magazine The Recitals here.
→ Check out the latest UPSC Syllabus here.
→ Download UPSC Model Answers for Mains 2026
→ UPSC Mains Question Paper 2026 is out now for Essay & GS Paper 1, 2, 3 & 4.
→ UPSC Calendar 2027 has been released.
→ Enroll in Vajiram & Ravi’s UPSC Mains Test Series 2027 for structured answer writing practice, expert evaluation, and exam-oriented feedback.
→ Join Vajiram & Ravi’s UPSC Mentorship Program 2027 for personalized guidance, strategy planning, and one-to-one support from experienced mentors.
→ Go through the UPSC Mains Previous Year Papers to enhance your preparation.
→ UPSC has released UPSC Toppers List 2025 with the Civil Services final result on its official website.
→ Also check Best UPSC Coaching in India
Multidimensional Poverty Index FAQs
Q1. Who publishes the Global Multidimensional Poverty Index?+
Q2. When was the MPI introduced?+
Q3. What are the three dimensions of the global MPI?+
Q4. What is India’s MPI score in the 2026 report?+
Q5. Which dimension contributes the most to India’s MPI?+
Tags: multidimensional poverty index quest UPSC Social Justice Notes