Jet Streams, Characteristics, Types, Formation, Impact

Jet Streams

Jet Streams are narrow, fast-moving air currents in the upper atmosphere that influence global weather and climate. They are found at high altitudes, flow mainly from west to east, and follow a wavy path called Rossby waves. Based on location and season, they are classified into Polar, Subtropical, Tropical Easterly, and Polar Night Jets, each affecting rainfall, storms, and monsoon patterns differently.

The detailed article on Jet Streams has been discussed below for a better understanding of the concepts.
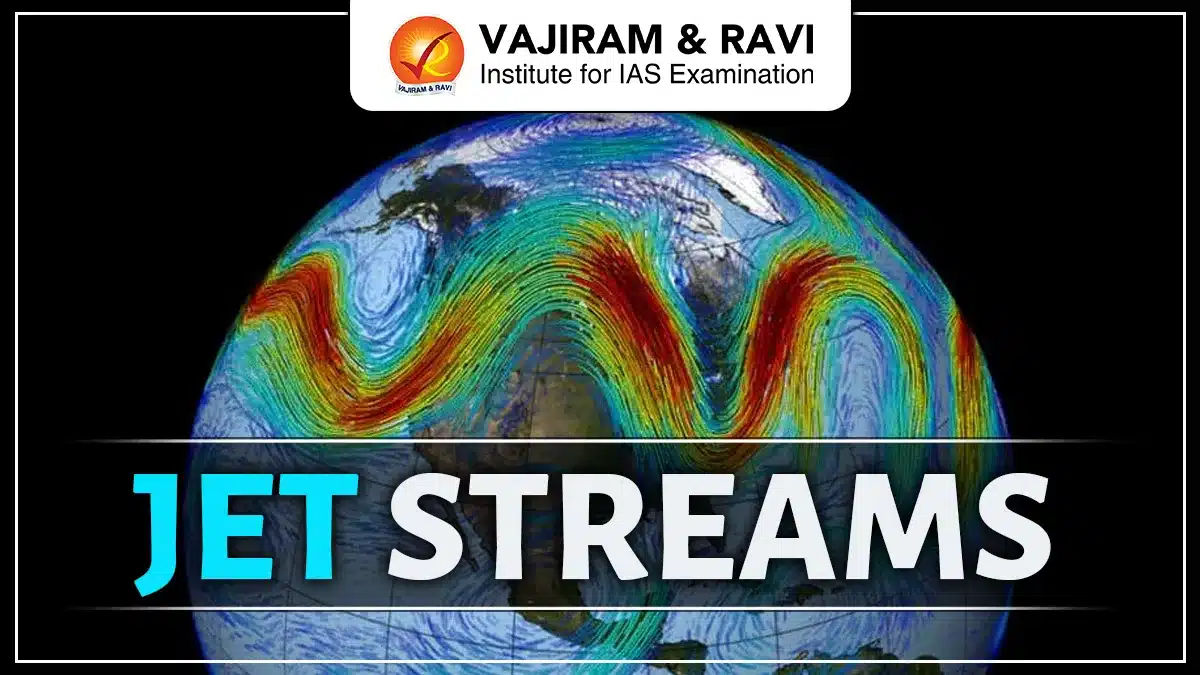
Jet Streams

Jet streams are fast-flowing winds in the upper atmosphere that move mainly from west to east and influence weather patterns across the globe. They form due to the temperature difference between the equator and the poles and are strongest at high altitudes. Jet streams guide storms, cyclones, and rainfall, and their position shifts with the seasons. Changes in their strength or path can cause extreme weather events like heatwaves, floods, or cold waves.

Also Read: Environment

Jet Streams Characteristics

The characteristics of Jet Streams have been shared below.

  • Jet Streams are found at high altitudes in the upper troposphere and lower stratosphere, mainly between 20° latitude and the polar regions, at about 9–16 km height.
  • Blow primarily from west to east (westerlies) due to Earth’s rotation and pressure gradient forces.
  • Possess very high wind speeds, generally ranging from 150 to over 300 km/h, with maximum speed at the jet core.
  • Strength of jet streams increases in winter because of a greater temperature difference between polar and tropical air.
  • Follow a wavy path known as Rossby waves, instead of a straight flow, influencing weather systems.
  • Show seasonal shifting, moving northward in summer and southward in winter, extending closer to the equator during winter.
  • Form due to a strong thermal gradient between cold polar air and warm tropical air masses.
  • Exhibit strong vertical and horizontal wind shear, leading to clear-air turbulence that affects aircraft.
  • Are circumpolar in nature, encircling the Earth in both hemispheres, though their paths are irregular and dynamic.

Types of Jet Streams

Based on their location, altitude, and seasonal behavior, jet streams are broadly classified into permanent (zonal) jet streams and seasonal or temporary jet streams.

Permanent (Zonal) Jet Streams

  1. Polar Jet Stream (Polar Front Jet)

The Polar Jet Stream is located in the mid-latitudes, around 45°–60°, where cold polar air meets warm tropical air. It is strongest during winter, shows large meanders, and is a major driver of mid-latitude weather systems and storms.

  1. Subtropical Jet Stream

The Subtropical Jet Stream occurs near 30°–35° latitudes and is generally weaker and more stable than the polar jet. It is often associated with descending air and relatively stable or fair weather conditions in subtropical regions.

Seasonal and Temporary Jet Streams

  1. Tropical Easterly Jet (TEJ)

The Tropical Easterly Jet develops during summer over India and Africa due to intense heating of the Tibetan Plateau. It flows from east to west and is crucial for strengthening monsoon circulation and rainfall.

  1. Polar Night Jet

The Polar Night Jet forms in the stratosphere over polar regions during winter because of extreme temperature differences. It is distinct from the polar front jet and mainly influences upper-atmospheric circulation.

  1. Low-Level Jet Streams (e.g., Somali Jet)

Low-level jet streams occur in the lower troposphere, with the Somali Jet being a notable example. It transports large amounts of moisture towards the Indian subcontinent, playing an important role in monsoon rainfall.

Also Read: Western Disturbances

Formation of Jet Streams

Jet streams are formed due to the uneven heating of the Earth’s surface, which creates strong temperature and pressure differences between the equator and the poles. These differences, combined with Earth’s rotation, lead to the development of fast-moving winds in the upper atmosphere.

  • The equatorial region receives more solar energy than the polar regions, creating a thermal gradient between warm and cold air masses.
  • Warm air rises and moves poleward in the upper atmosphere, while cold air moves equatorward near the surface.
  • This movement of air generates pressure differences at higher altitudes.
  • Air flows from high-pressure to low-pressure zones, accelerating in the process.
  • Due to the Coriolis force, moving air is deflected, resulting in a dominant west-to-east flow.
  • Jet streams form near the tropopause, where temperature contrasts are strongest.
  • During winter, increased temperature differences make jet streams stronger and faster.

Latitudinal and Seasonal Shifting of Jet Streams

Jet Streams do not remain fixed at one location and shift both latitudinally and seasonally in response to changes in solar heating. Their position and strength vary throughout the year, strongly influencing weather and climate patterns.

  • Jet streams move northward during summer as the Sun’s direct rays shift toward higher latitudes.
  • In winter, they shift southward toward the equator due to the expansion of cold polar air.
  • Winter jet streams are stronger and more extensive because of a sharper temperature contrast between polar and tropical regions.
  • During summer, the temperature gradient weakens, causing jet streams to weaken and move poleward.
  • Seasonal shifting affects the paths of cyclones and storm systems.
  • Irregular or delayed shifting can lead to extreme weather events such as heatwaves, cold waves, or heavy rainfall.

Jet Streams and Cyclone Formation

Jet Streams play a crucial role in the formation, intensification, and movement of cyclones by controlling upper-air circulation. Their position and strength determine how cyclonic systems develop and travel.

  • Jet streams help in upper-level divergence, which removes air from the top of a developing cyclone and allows surface pressure to fall.
  • Strong jet streams provide the necessary energy and ventilation for cyclones to intensify.
  • Cyclones often move along the path guided by jet streams, which act as steering currents.
  • A fast-moving jet stream can cause cyclones to intensify rapidly and move quickly.
  • Weak or blocked jet streams may result in slow-moving cyclones, leading to prolonged rainfall and flooding.
  • Interaction between jet streams and low-pressure systems is essential for the development of temperate cyclones.

Influence of Jet Streams on Indian Monsoon

Jet Streams have a decisive influence on the onset, strength, and distribution of monsoon rainfall over the Indian subcontinent. Their seasonal shifting controls the large-scale atmospheric circulation associated with the monsoon.

  • During summer, the Subtropical Westerly Jet Stream shifts north of the Himalayas, allowing warm, moist monsoon winds to enter India.
  • The development of the Tropical Easterly Jet (TEJ) over India strengthens upper-level divergence and supports active monsoon conditions.
  • A strong TEJ is associated with good and widespread monsoon rainfall.
  • If the westerly jet fails to shift northward, it can delay the onset of the monsoon.
  • Variations in jet stream position and strength may cause breaks in monsoon rainfall or regional droughts.

Impact of Jet Streams on Aviation

Jet Streams play an important role in aviation by affecting flight speed, fuel use, and safety. Aircraft flying in the direction of jet streams can save time and fuel, while flying against them increases travel time. Strong jet streams often cause clear-air turbulence, which can be dangerous as it is hard to detect. Therefore, pilots carefully plan flight routes using jet stream forecasts to ensure safe and efficient air travel.

Changes in Jet Streams due to Global Warming

  • Global warming is causing faster warming of polar regions compared to the tropics, a phenomenon known as polar amplification.
  • This reduces the temperature (thermal) gradient between the equator and the poles, which is the main driving force of jet streams.
  • A weaker thermal gradient leads to weaker jet streams with reduced wind speeds.
  • Jet streams are becoming more wavy and irregular, showing larger Rossby wave amplitudes.
  • Increased waviness causes weather systems to move slowly or remain stationary over a region.
  • This results in prolonged extreme weather events such as heatwaves, cold spells, floods, and droughts.
  • Weaker and unstable jet streams can lead to frequent blocking patterns, disrupting normal weather flow.
  • Changes in jet stream behavior are affecting monsoon patterns and mid-latitude storm tracks.

Jet Streams UPSC Prelims PYQs

  1. Consider the following statements: (2020, UPSC CSE Prelims)
  1. Jet streams occur in the Northern Hemisphere only.
  2. Only some cyclones develop an eye.
  3. The temperature inside the eye of a cyclone is nearly 10°C lesser than that of the surroundings.

Which of the statements given above is/are correct?

(a) 1 and 2 only

(b) 2 and 3 only

(c) 3 only

(d) 1, 2 and 3

Answer: (b)

Jet Streams FAQs

Q1: What are jet streams?

Ans: Jet streams are narrow bands of very fast-moving winds found in the upper levels of the atmosphere that strongly influence weather and climate.

Q2: At what altitude do jet streams occur?

Ans: They usually occur at a height of about 9 to 16 km above sea level in the upper troposphere and lower stratosphere.

Q3: In which direction do jet streams flow?

Ans: Most jet streams flow from west to east due to Earth’s rotation and pressure differences.

Q4: Why are jet streams important?

Ans: They guide weather systems, influence rainfall and storms, affect monsoon behavior, and impact aviation.

Q5: Do jet streams change their position?

Ans: Yes, jet streams shift seasonally and latitudinally based on temperature changes and solar heating.

UPSC Daily Quiz 3 January 2026

UPSC Daily Quiz
[WpProQuiz 58]

UPSC Daily Quiz FAQs

Q1: What is the Daily UPSC Quiz?

Ans: The Daily UPSC Quiz is a set of practice questions based on current affairs, static subjects, and PYQs that help aspirants enhance retention and test conceptual clarity regularly.

Q2: How is the Daily Quiz useful for UPSC preparation?

Ans: Daily quizzes support learning, help in revision, improve time management, and boost accuracy for both UPSC Prelims and Mains through consistent practice.

Q3: Are the quiz questions based on the UPSC syllabus?

Ans: Yes, all questions are aligned with the UPSC Syllabus 2025, covering key areas like Polity, Economy, Environment, History, Geography, and Current Affairs.

Q4: Are solutions and explanations provided with the quiz?

Ans: Yes, each quiz includes detailed explanations and source references to enhance conceptual understanding and enable self-assessment.

Q5: Is the Daily UPSC Quiz suitable for both Prelims and Mains?

Ans: Primarily focused on Prelims (MCQ format), but it also indirectly helps in Mains by strengthening subject knowledge and factual clarity.

Geological Time Scale, Definition, Principles, Divisions

Geological Time Scale

The Geological Time Scale is a scientifically developed framework that explains Earth’s history using evidence preserved in rocks, fossils, and geochemical signatures. It helps scientists understand when major changes occurred, including the formation of mountains, climate shifts, mass extinctions and the evolution of life. It is maintained by the International Commission on Stratigraphy under the International Union of Geological Sciences.

Geological Time Scale

The Geological Time Scale is based on chronostratigraphy, which relates rock strata to time intervals and geochronology and assigns numerical ages using methods such as radiometric dating, paleomagnetism and fossil correlation. The scale expresses deep time in ‘million years ago’ and provides a universal reference for Earth history studies. Geological ages are expressed in billion years (Ga), million years (Ma) and thousand years (ka).

Also Read: Solar System

Geological Time Scale Principles

The Geological Time Scale is built on fundamental stratigraphic principles that establish relative ages of rocks and events. The list of major principles involved in the determination of Geologic Time are:

  • Law of Superposition: In undisturbed sedimentary sequences, older rock layers occur below younger layers, forming the basic rule for determining relative ages of strata.
  • Principle of Original Horizontality: Sediments are originally deposited in horizontal layers, and any tilting or folding occurred after deposition due to tectonic forces.
  • Principle of Lateral Continuity: Sedimentary layers initially extend laterally until they thin out or encounter a barrier, allowing correlation of rock units across distances.
  • Principle of Faunal Succession: Fossil assemblages follow a consistent vertical order, enabling correlation of rock layers even across continents.
  • Chronostratigraphic Correlation: Rock units are matched globally using fossils, lithology, paleomagnetism, and isotope data to establish standardized time boundaries.

Geological Time Scale Divisions

The Geological Time Scale divides Earth’s 4.54 billion year history into hierarchical units that reflect major geological and biological changes documented in the rock record.

1. Eon (Largest Division)

Eons represent the broadest phases of Earth history, each marked by major changes in Earth’s crust, atmosphere, and life forms.

  • Hadean Eon (≈ 4.6 - 4.0 billion years ago): Formation of Earth and Moon, molten surface, intense meteorite bombardment, no confirmed life record.
  • Archean Eon (≈ 4.0 - 2.5 billion years ago): Stabilization of continental crust, formation of oceans, first prokaryotic life, stromatolites, oxygen poor atmosphere.
  • Proterozoic Eon (≈ 2.5 billion - 538.8 million years ago): Rise of atmospheric oxygen (Great Oxidation Event), eukaryotes, multicellular life, Snowball Earth glaciations.
  • Phanerozoic Eon (538.8 million years ago - Present): Abundant fossil record, complex plants and animals, major evolutionary radiations and extinctions.

2. Era (Subdivision of Eon)

Eras divide eons based on dominant life forms and major global events. Eras within the Phanerozoic Eon are: 

  • Paleozoic Era (538.8 - 251.9 million years ago): Explosion of marine life, first land plants and animals, formation of Pangaea, ends with largest mass extinction.
  • Mesozoic Era (251.9 - 66 million years ago): Age of reptiles and dinosaurs, breakup of Pangaea, origin of birds and flowering plants.
  • Cenozoic Era (66 million years ago - Present): Age of mammals, development of grasslands, cooling climate, evolution of humans.

3. Period (Subdivision of Era)

Periods mark significant geological, climatic, and biological transitions. Each period is defined by fossil assemblages, tectonic events, or mass extinctions. Major Periods of the Phanerozoic:

  • Paleozoic Periods: Cambrian, Ordovician, Silurian, Devonian, Carboniferous, Permian
  • Mesozoic Periods: Triassic, Jurassic, Cretaceous
  • Cenozoic Periods: Paleogene, Neogene, Quaternary

4. Epoch (Subdivision of Period)

Epochs capture finer scale changes, especially climate shifts and evolutionary developments. Example of Epoch under the Quaternary Period are:

  • Pleistocene Epoch (≈ 2.58 million - 11,700 years ago)- Ice ages, megafauna
  • Holocene Epoch (11,700 years ago - Present)- Stable climate, human civilization

5. Age (Smallest Formal Unit)

Ages represent the most precise divisions, often spanning thousands to a few million years. It is defined using climatic evidence of a global drought event. Example: Meghalayan Age (since ~4,200 years ago).

Also Read: Interior of the Earth

Extraterrestrial Geological Time Scale

Extraterrestrial Geological Time Scale classifies the geological evolution of solid celestial bodies using surface features, impact records, and volcanic history.

Lunar (Selenological) Time Scale

The lunar time scale is based on impact cratering, volcanism, and surface erosion without implying fundamental process changes.

  • Pre - Nectarian: Oldest crust formation and intense early bombardment.
  • Nectarian: Large basin forming impacts dominate surface evolution.
  • Imbrian: Major volcanism and extensive basaltic lava flows.
  • Eratosthenian: Marks the period fro 3.2 to 1.1 million years ago
  • Copernican: It defines the period after 1.1 million years till today with presence of craters.

Martian Geologic Time Scale

Mars’ geologic history is reconstructed using crater density and mineral alteration evidence.

  • Pre - Noachian: Earliest crust formation (~4,500 - 4,100 Ma).
  • Noachian: Heavy bombardment and widespread water related features.
  • Hesperian: Volcanism and surface drying (~3,700 - 3,000 Ma).
  • Amazonian: Cold, dry conditions continuing to the present.

Geological Time Scale FAQs

Q1: What is the Geological Time Scale?

Ans: The Geological Time Scale is a chronological framework that divides Earth’s 4.6-billion-year history based on rock layers and fossils.

Q2: Who developed the Geological Time Scale?

Ans: It was developed gradually by geologists in the 19th century using stratigraphy, fossil records, and later radiometric dating.

Q3: What are the main divisions of the Geological Time Scale?

Ans: The main divisions are eons, eras, periods, epochs, and ages, arranged from largest to smallest time units.

Q4: Which Eon are we currently living in?

Ans: We are living in the Phanerozoic Eon specifically in the Cenozoic Era and Quaternary Period.

Q5: Why is the Geological Time Scale important?

Ans: It helps scientists understand Earth’s evolution, mass extinctions, climate changes, and the development of life over time.

Climate of India, Climatic Regions, Seasons, Factors Affecting

Climate of India

The Climate of India is extremely diverse due to its vast size, varied relief, latitude, and monsoon driven wind systems. From tropical coasts to alpine Himalayas, India experiences sharp contrasts in temperature, rainfall, and seasonal patterns, making it one of the world’s most climatically complex countries.

Climate of India

India largely experiences a tropical monsoon climate, but its climatic conditions vary significantly across regions due to altitude, distance from the sea, and other factors. According to the Köppen classification, India includes tropical wet, tropical savanna, arid desert, semi arid steppe, humid subtropical, montane, sub arctic, tundra, and ice cap climates. The Himalayas block cold Central Asian winds, while the Thar Desert intensifies monsoon circulation. Average annual temperatures range from below 20°C in Himalayan zones to above 27.5°C across most of peninsular India.

Climatic Regions of India

There are multiple Climatic Regions in India influenced by temperature, rainfall patterns, altitude variation, monsoon influence, humidity, etc. The major Climatic Regions of India are:

  • Tropical Monsoon Climate: Found along the Western Ghats, northeast India, and islands, this region receives over 2000 mm rainfall annually with year round temperatures above 18°C.
  • Tropical Savanna Climate: Dominant over peninsular interiors, it records 750 - 1500 mm rainfall, long dry seasons, and extreme summer temperatures often exceeding 40°C.
  • Arid Desert Climate: Western Rajasthan experiences less than 300 mm annual rainfall, large diurnal temperature range, and summer maxima crossing 50°C.
  • Semi Arid Steppe Climate: Covering parts of Maharashtra, Karnataka, Telangana, and Andhra Pradesh, this zone receives 400 - 750 mm rainfall and is drought prone.
  • Humid Subtropical Climate: Northern plains and northeast India receive 1000 - 2500 mm rainfall with hot summers, cool winters, and strong monsoon dependence.
  • Subtropical Highland Climate: Himalayan foothills show mild summers, cold winters, frequent fog, and rainfall influenced by monsoon and western disturbances.
  • Montane and Alpine Climate: High Himalayas experience sharp temperature fall with altitude, heavy snowfall above 1500 m, and tundra like conditions beyond snowline.

Seasons of India

Ancient Indian calendars divide the year into six ritus: Vasanta (Spring), Grishma (Summer), Varsha (Monsoon), Sharad (Autumn), Hemanta (Pre-winter) and Shishira (Winter). However, the India Meteorological Department recognizes four main seasons as given below:

  • Winter Season (December - February): Temperatures range from 10 - 15°C in northwest plains to 25°C in south; western disturbances cause rainfall and snowfall.
  • Summer Season (March - May): Temperatures exceed 40°C in interiors; Rajasthan recorded 51.0°C at Phalodi in May 2016, India’s highest verified temperature.
  • Southwest Monsoon Season (June - September): Supplies over 80% of annual rainfall; monsoon onset begins around June 1 in Kerala, covering India by July.
  • Post Monsoon Season (October - November): Northeast monsoon brings rainfall to Tamil Nadu, Puducherry, and coastal Andhra Pradesh after southwest monsoon withdrawal.
  • Additional Spring Phase: Himalayan and northern plains experience a short spring with mild temperatures before intense summer heating begins.

Climate of India Features

India’s climate shows distinct characteristics influenced by the monsoon reversal, rainfall concentration, temperature extremes, regional atmospheric variability, etc. The key features of the Climate of India are:

  • Monsoon Wind Reversal: Seasonal reversal of winds causes moist southwest monsoon in summer and dry northeast winds in winter.
  • Seasonal Rainfall Concentration: Over 75% to 80% rainfall occurs between June and September, creating flood - drought cycles across regions.
  • Extreme Temperature Range: Temperatures vary from -45°C at Dras, Ladakh, to over 51°C at Phalodi, Rajasthan.
  • High Regional Variability: Mawsynram receives over 11,800 mm rainfall annually, while Jaisalmer receives less than 100 mm.
  • Coastal Moderation: Coastal areas experience smaller diurnal temperature ranges due to maritime influence of the Indian Ocean.
  • Natural Disaster Proneness: Floods, cyclones, droughts, heatwaves, and landslides frequently occur due to climatic variability.

Factors Affecting Climate of India

The Climate of India is controlled by latitude, relief, pressure systems, wind patterns, oceanic influence, and large scale atmospheric circulation:

  • Latitude: Tropic of Cancer divides tropical south and subtropical north, influencing solar radiation and seasonal temperature variation.
  • Himalayas: Act as a barrier preventing cold Central Asian winds and forcing monsoon winds to release moisture over India.
  • Thar Desert: Helps attract southwest monsoon winds by creating intense low pressure zones during summer.
  • Distance from Sea: Coastal regions experience moderated temperatures, while interiors face extreme heat and cold.
  • Altitude: Temperature decreases with height, producing temperate and alpine climates in hill regions.
  • Jet Streams: Tropical easterly and subtropical westerly jets influence monsoon onset, withdrawal, and rainfall intensity.
  • Western Disturbances: Mediterranean origin storms bring winter rain and snow to northwest India and Himalayas.
  • Ocean Currents: Warm Indian Ocean waters enhance evaporation and monsoon moisture supply, and eventually leading to various phenomena such as El Nino, La Nina, etc.

Climate Change

Climate Change is intensifying temperature rise, glacier retreat, extreme events  and sea level risks across India’s diverse climatic regions.

  • Rising Temperatures: India’s mean temperature increased by about 0.7°C between 1901 and 2018, increasing heatwave frequency.
  • Glacier Retreat: Himalayan glaciers are shrinking, threatening long term flows of Ganga, Brahmaputra, and Indus rivers.
  • Extreme Rainfall: Cities like Mumbai have recorded single day rainfall above 900 mm, increasing flood risks.
  • Sea Level Rise: Coastal zones face erosion and saline intrusion, affecting livelihoods and mangrove ecosystems.
  • Emissions Profile: India emits around 3 gigatonnes CO2 equivalent annually, about 7% of global emissions.
  • Vulnerability Ranking: India ranks among the most climate affected countries due to population exposure and economic dependence on monsoon.

Climate of India FAQs

Q1: What type of Climate does India have?

Ans: India has a monsoon type climate marked by seasonal reversal of winds and uneven rainfall distribution.

Q2: What controls the Climate of India?

Ans: Latitude, altitude, Himalayan barrier, pressure systems, jet streams, and monsoon winds control India’s climate.

Q3: How many Seasons are recognized in the Climate of India?

Ans: The India Meteorological Department identifies four seasons: winter, summer, southwest monsoon, and retreating monsoon.

Q4: Why is the Indian monsoon important?

Ans: Nearly 75% of India’s annual rainfall occurs during the southwest monsoon, crucial for agriculture and water security.

Q5: How does Climate variability affect India?

Ans: Climate variability increases extreme events like floods, droughts, heatwaves, and cyclones, impacting food production and livelihoods.

Parts of Plants, Classification, Structure, Diagram, Functions

Parts of Plants

Parts of Plants together form a highly organised living system that enables growth, nutrition, reproduction, transport, and survival across diverse environments. Plants are autotrophic organisms that synthesise food using sunlight and act as the foundational producers in terrestrial and aquatic ecosystems. Their body structure is adapted for a stationary lifestyle, efficient resource absorption, internal transport, mechanical support, and long term survival. Each part of a plant is structurally specialised and functionally coordinated, ensuring division of labour at cellular, tissue, and organ levels. This structural efficiency allows plants to thrive from deserts to rainforests and from freshwater to saline habitats.

[my_image src="https://vajiramandravi.com/current-affairs/wp-content/uploads/2026/01/Parts-of-Plants.webp" size="full" align="none" width="auto" height="461px" alt="Parts of Plants" title="Parts of Plants"]

Also Read: Plant Tissue

Parts of Plants Classification

Parts of Plants are broadly classified into major organ systems based on position and function. The two major classes of a Plant Anatomy are:

1. Root System (Underground Parts of Plants)

The root system comprises underground structures responsible for anchorage, absorption, storage, and respiration in special conditions. 

  1. Types of Root System
  • Tap Root System
    • Primary root + secondary and tertiary roots
    • Found in dicot plants (e.g., mustard)
  • Fibrous Root System
    • Many roots of similar size from stem base
    • Found in monocot plants (e.g., wheat)
  • Adventitious Root System
    • Roots arising from stem or leaves
    • Found in banyan, grass, Monstera
  1. Structural Regions of Root
  • Root Cap: Protects growing tip
  • Meristematic Zone: Cell division
  • Elongation Zone: Increase in length
  • Maturation Zone: Root hairs for absorption
  1. Root Modifications
  • Storage Roots: Carrot, sweet potato
  • Support Roots: Prop roots (banyan), stilt roots (maize)
  • Respiratory Roots: Pneumatophores (Rhizophora)

2. Shoot System (Aerial Parts of Plants)

The shoot system includes all above ground parts such as stem, leaves, flowers, fruits, and seeds, which together perform photosynthesis, transport, reproduction, and dispersal.

  1. Stem
      1. External Structure
        • Node: Region where leaves arise
        • Internode: Region between two nodes
        • Axillary Bud: Develops into branches
        • Terminal Bud: Responsible for growth in length
      2. Stem Modifications
        • Underground Stems: Storage (potato, ginger)
        • Aerial Stems: Tendrils (cucumber), thorns (Bougainvillea)
        • Photosynthetic Stems: Opuntia, Euphorbia

2. Leaf

      1. Main Parts of a Leaf
        • Leaf Base: Attaches leaf to stem
        • Petiole: Holds lamina towards light
        • Lamina (Leaf Blade): Broad green surface
      2. Venation
        • Reticulate Venation: Network pattern (dicots)
        • Parallel Venation: Parallel veins (monocots)
      3. Leaf Modifications
        • Tendrils: Pea (climbing)
        • Spines: Cactus (protection)
        • Fleshy Leaves: Onion (storage)
        • Insectivorous Leaves: Pitcher plant

3. Flower (Reproductive Structure)

      1. Floral Whorls
        • Calyx (Sepals): Protection
        • Corolla (Petals): Attraction
        • Androecium (Stamens): Male part
        • Gynoecium (Carpels): Female part
      2. Types of Flowers
        • Bisexual: Both androecium and gynoecium
        • Unisexual: Only male or female organs

4. Fruit

      1. Structure of Fruit
        • Pericarp: Fruit wall
        • Seed(s): Fertilised ovules
      2. Types
        • Fertilised Fruit: Normal fruit formation
        • Parthenocarpic Fruit: Fruit without fertilisation

5. Seed

    1. Components of Seed
      • Seed Coat: Protection
      • Embryo: Future plant
      • Cotyledons: Food storage
    2. Types
      • Monocot Seeds: One cotyledon
      • Dicot Seeds: Two cotyledons

Also Read: Plant Kingdom

Parts of Plants Structures

Parts of Plants show specialised anatomical structures enabling absorption, transport, photosynthesis, reproduction, protection, and survival across varied ecological conditions.

  • Root Structure: Roots consist of root cap, meristematic zone, elongation zone, and maturation zone, with root hairs increasing absorptive surface area for water and mineral uptake.
  • Tap Root System: Formed from radicle elongation in dicots like mustard, comprising a primary root with secondary and tertiary branches, providing strong anchorage and deep soil penetration.
  • Fibrous Root System: Found in monocots like wheat, where numerous equal sized roots arise from stem base, enhancing surface absorption but offering weaker anchorage.
  • Adventitious Roots: Originate from non radicle regions such as stems or leaves, seen in banyan (prop roots), maize (stilt roots), and sweet potato (storage roots).
  • Pneumatophores: Specialized upward growing roots in swamp plants like Rhizophora that possess lenticels for gaseous exchange in oxygen deficient soils.
  • Stem Structure: Stem contains nodes, internodes, vascular bundles, and buds, acting as a mechanical axis and transport pathway between roots and leaves.
  • Modified Underground Stems: Potato (tuber), ginger (rhizome), turmeric, and colocasia store carbohydrates and enable vegetative reproduction.
  • Stem Tendrils: Slender, coiled structures arising from axillary buds in climbers like cucumber and grapevine, aiding mechanical support through twining.
  • Thorns: Woody, pointed stem modifications in Citrus and Bougainvillea that provide protection against herbivores.
  • Photosynthetic Stems: Flattened stems in Opuntia and cylindrical stems in Euphorbia contain chlorophyll and compensate for reduced leaves.
  • Leaf Structure: Leaves originate from shoot apical meristems and consist of leaf base, petiole, and lamina with midrib, veins, and veinlets.
  • Venation Pattern: Reticulate venation in dicots forms a network, while parallel venation in monocots runs longitudinally, reflecting evolutionary divergence.
  • Stomatal Apparatus: Epidermal pores surrounded by guard cells regulate gas exchange and transpiration, maintaining water balance and temperature control.
  • Flower Structure: Flowers consist of calyx (sepals), corolla (petals), androecium (stamens), and gynoecium (carpels), forming reproductive units in angiosperms.
  • Androecium: Male reproductive part with filament and bilobed anther containing pollen sacs where microspores develop into pollen grains.
  • Gynoecium: Female reproductive part composed of stigma, style, and ovary containing ovules that develop into seeds after fertilisation.
  • Fruit Structure: Fruits are mature ovaries with pericarp layers enclosing seeds, aiding protection and dispersal; parthenocarpic fruits form without fertilisation.
  • Seed Structure: Seeds contain embryo, cotyledons, protective seed coat, and stored food supporting early seedling development before photosynthesis begins.

Parts of Plants Functions

Parts of Plants perform coordinated physiological functions ensuring nutrition, transport, reproduction, growth regulation, and environmental adaptation.

  • Absorption Function: Roots absorb water and dissolved minerals through root hairs using diffusion, osmosis, and active transport mechanisms.
  • Anchorage Function: Extensive root networks stabilise plants against wind and soil erosion, especially in tall trees and grasses.
  • Storage Function: Modified roots and stems store starch, sugars, and proteins, enabling survival during unfavourable seasons.
  • Transport of Water: Xylem tissue conducts water and minerals from roots to aerial parts through transpiration pull and capillary action.
  • Transport of Food: Phloem tissue distributes photosynthates from leaves to growing and storage regions using a pressure flow mechanism.
  • Photosynthesis: Leaves synthesise glucose using chlorophyll, sunlight, carbon dioxide, and water, forming the energy base of ecosystems.
  • Transpiration: Evaporation of water through stomata generates suction force, cools plant surfaces, and facilitates mineral transport.
  • Reproduction: Flowers enable sexual reproduction through pollination and fertilisation, ensuring genetic variation and species continuity.
  • Seed Dispersal: Fruits aid dispersal by wind, water, animals, or mechanical bursting, expanding plant distribution.
  • Protection: Thorns, spines, thick cuticles, and seed coats defend plants against herbivory, dehydration, and mechanical damage.
  • Vegetative Propagation: Modified stems, leaves, and roots allow rapid asexual reproduction without seed formation.
  • Respiration Support: Pneumatophores and lenticels facilitate oxygen diffusion in waterlogged or compact soils.
  • Environmental Adaptation: Structural modifications enable plants to survive in deserts, aquatic habitats, cold regions, and nutrient poor soils.

Parts of Plants FAQs

Q1: What are the main Parts of Plants?

Ans: A plant mainly has roots, stem, leaves, flowers, fruits, and seeds, which together perform nutrition, transport, growth, and reproduction.

Q2: What are the two organ systems of Plants?

Ans: Plants have two organ systems: the root system (underground parts) and the shoot system (above ground parts).

Q3: What is the function of roots in Plants?

Ans: Roots anchor the plant, absorb water and minerals from soil, store food, and help in respiration in some plants.

Q4: Why are leaves called the food factory of Plants?

Ans: Leaves perform photosynthesis using sunlight, carbon dioxide, and water to prepare food for the plant.

Q5: What role do flowers play in Plants?

Ans: Flowers are the reproductive organs of plants that help in pollination, fertilisation, and formation of fruits and seeds.

Parts of Indian Constitution, Check All 25 Parts Subject, Key Details

Parts of Indian Constitution

The Constitution of India, adopted in 1950, originally consisted of 395 Articles, 22 Parts, and 8 Schedules. Over time, through amendments, its scope has expanded to address emerging needs of governance and society. Today, the Constitution contains 448 Articles, 25 Parts, and 12 Schedules.

The Parts of Indian Constitution serve as the backbone, organizing its provisions into broad themes such as fundamental rights, directive principles, governance structure, and emergency provisions. Later additions like Part IXA (Municipalities), Part IXB (Co-operative Societies), and Part XIVA (Tribunals) highlight the evolving nature of constitutional law in India.

It’s also important to note that when new Articles or Parts are inserted, they are numbered alphabetically (like Article 21A) to maintain the document’s structure without disrupting the original sequence.

Parts of Indian Constitution 

The Constitution of India is not just a legal document but also the supreme law of the land. It lays down the framework of governance by defining the roles of people in positions of authority and clearly outlining the limitations on their power. At the same time, it secures the rights, powers, procedures, and duties of both the government and the citizens.

What makes it unique is its emphasis on the supremacy of the Constitution itself, rather than the supremacy of the legislature. This ensures that every law and every action of the government remains within the constitutional framework.

To understand this structure better, here’s an overview of the Parts of the Indian Constitution presented in a table:

Parts of Indian Constitution Overview

Particulars

Details

Constitution formed on

26th November 1949

Parts of Indian Constitution Originally

22 Parts

Parts of Indian Constitution at Present

25 Parts

New Parts added in Constitution

  • Part IX A of the Constitution was inserted by the Constitution (74th Amendment) Act, 1992. It contains provisions for local self government at the urban level.
  • Part IXB of the Constitution grants constitutional status to co-operative societies and contains provisions for their democratic functioning. It was inserted by the Constitution (97th, Amendment) Act, 2011.
  • Part XIVA of the Indian Constitution provides for the appointment of tribunals for administrative and other disputes. It was not a part of the Constitution of India 1950, but was added by the Constitution (Forty-second Amendment) Act, 1942.

List of Parts of Indian Constitution

The Indian Constitution is a written document that serves as the supreme law of the land. It was drafted by the Constituent Assembly, with key contributions from leaders like Dr. B.R. Ambedkar, Rajendra Prasad, and Jawaharlal Nehru, and came into effect on January 26, 1950.

To ensure clarity and proper governance, the Constitution is divided into distinct sections that address specific subjects. Over time, it has expanded and now consists of 25 Parts, each focusing on different aspects of governance, rights, and duties.

List of Parts of Indian Constitution

Parts and Subject

Articles

Part I - The Union and its Territories

1 - 4

Part II - Citizenship

5 -11

Part III - Fundamental Rights

12 - 35

Part IV - Directive Principles of State Policy

36 - 51

Part IV A - Fundamental Duties

51A

Part V - The Union

52 - 151

Part VI - The States

152 - 237

Part VII - The States in Part B of First Schedule

238 [Repealed]

Part VIII - The Union Territories

239 - 242

Part IX - The Panchayats

243 - 243O

Part IXA - The Municipalities

243P - 243ZG

Part IXB - The Co-operative Societies

243ZH - 243ZT

Part X - The Scheduled and Tribal Areas

244 - 244A

Part XI - Relation between the Union and the States

245 - 263

Part XII - Finance, Property, Contracts and Suits

264 - 300A

Part XIII - Trade, Commerce and Intercourse within the territory of India

301 - 307

Part XIV - Services Under the Union and the States

308 - 323

Part XIVA - Tribunals

323A - 323B

Part XV - Elections

324 - 329A

Part XVI - Special provisions relating to certain classes

330 - 342

Part XVII - Official language

343 - 351

Part XVIII - Emergency Provisions

352 - 360

Part XIX - Miscellaneous

361 - 367

Part XX - Amendment of the Constitution

368

Part XXI - Temporary, Transitional and Special Provisions

369 - 392

Part XXII - Short Title, Commencement, Authoritative Text in Hindi and Repeals

393 - 395

Parts of Indian Constitution Details

The Constitution of India is the supreme law of the land. It was adopted on 26 January 1950 and originally contained 395 Articles, 22 Parts, and 8 Schedules. Today, through amendments, it has expanded to 448 Articles, 25 Parts, and 12 Schedules.

Each Part of the Constitution deals with a specific subject - from Union and State structures to rights, duties, emergency provisions, and governance frameworks. 

Parts of Indian Constitution Details

Part

Articles Covered

Subject / Theme

Brief Explanation

Part I

Articles 1 - 4

The Union and its Territory

Defines India as a Union of States; regulates formation of new states and alteration of boundaries.

Part II

Articles 5 - 11

Citizenship

Lays down provisions for citizenship at the commencement of the Constitution and rules for acquisition/termination.

Part III

Articles 12 - 35

Fundamental Rights

Guarantees six categories of Fundamental Rights to citizens, inspired by the US Bill of Rights.

Part IV

Articles 36 - 51

Directive Principles of State Policy (DPSP)

Guidelines for the State to establish a just society; non-justiciable but fundamental to governance.

Part IVA

Article 51A

Fundamental Duties

Lists 11 duties of citizens, added by the 42nd Amendment (1976) on recommendation of Swaran Singh Committee.

Part V

Articles 52 - 151

The Union

Deals with the Union Government - Executive (President, PM, Council of Ministers), Parliament, and Judiciary.

Part VI

Articles 153 - 237

The States

Deals with State Governments - Governors, State Legislature, and High Courts.

Part VII

[Repealed]

States in Part B

Dealt with Part B states; repealed by the 7th Amendment (1956).

Part VIII

Articles 239 - 242

Union Territories

Provides for administration of Union Territories by the President through Administrators.

Part IX

Articles 243 - 243O

The Panchayats

Establishes Panchayati Raj system (73rd Amendment, 1992) for rural local self-government.

Part IXA

Articles 243P - 243ZG

The Municipalities

Establishes urban local bodies (74th Amendment, 1992) with structure, powers, and responsibilities.

Part IXB

Articles 243ZH - 243ZT

Co-operative Societies

Provides for regulation and management of co-operatives (97th Amendment, 2011).

Part X

Articles 244 - 244A

Scheduled and Tribal Areas

Deals with administration of Scheduled Areas (Fifth Schedule) and Tribal Areas (Sixth Schedule).

Part XI

Articles 245 - 263

Relations between the Union and States

Lays down legislative, administrative, and financial relations between the Centre and States.

Part XII

Articles 264 - 300A

Finance, Property, Contracts, and Suits

Covers distribution of revenues, borrowing powers, property rights, and legal suits involving government.

Part XIII

Articles 301 - 307

Trade, Commerce, and Intercourse

Ensures freedom of trade and commerce across India; modeled on Australian Constitution.

Part XIV

Articles 308 - 323

Services under Union and States

Covers recruitment, conditions of service, and role of Public Service Commissions.

Part XIVA

Articles 323A - 323B

Tribunals

Provides for Administrative Tribunals and other tribunals for speedy justice (42nd Amendment, 1976).

Part XV

Articles 324 - 329A

Elections

Deals with conduct of elections; empowers Election Commission of India.

Part XVI

Articles 330 - 342

Special Provisions for Certain Classes

Safeguards for SCs, STs, and Anglo-Indians, including reservation of seats.

Part XVII

Articles 343 - 351

Official Language

Declares Hindi in Devanagari script as official language; provides for use of English and development of regional languages.

Part XVIII

Articles 352 - 360

Emergency Provisions

Provides for National Emergency, President’s Rule, and Financial Emergency.

Part XIX

Articles 361 - 367

Miscellaneous

Covers protection of President/Governors, privy purses, interpretation of Constitution, etc.

Part XX

Article 368

Amendment of the Constitution

Provides the procedure for constitutional amendments - flexible yet rigid.

Part XXI

Articles 369 - 392

Temporary, Transitional, and Special Provisions

Deals with temporary and special provisions for certain states and union territories.

Part XXII

Articles 393 - 395

Short title, Commencement, Authoritative Text, Repeals

Specifies short title, date of commencement, authoritative text in Hindi, and repeals of previous laws.

Parts of Indian Constitution FAQs

Q1: Are there 22 or 25 parts in the Indian Constitution?

Ans: Originally, the Constitution had 22 parts, but after subsequent amendments and additions, it now has 25 parts.

Q2: Why is part 7 removed?

Ans: Part 7 dealt with Part-B states. After the 7th Constitutional Amendment, 1956, Part-B states were merged with others, making this part redundant, so it was repealed.

Q3: What is part 8 of the Indian Constitution?

Ans: Part 8 (Articles 239-242) deals with Union Territories, their administration, governance, and special provisions.

Q4: What are the articles 1, 2, 3, 4, 5 of the Constitution?

Ans: Article 1 - India, that is Bharat, is a Union of States, Article 2 - Admission/establishment of new States, Article 3 - Formation of new States and alteration of areas/boundaries, Article 4 - Laws under Articles 2 & 3 not amendments under Article 368, Article 5 - Citizenship at the commencement of the Constitution.

Q5: How to remember 25 parts of the Indian Constitution?

Ans: Use a mnemonic chain technique. For example: “The Union’s State Needs Citizenship, Directive Policies, Emergency Provisions, Panchayati Raj, Tribunals...” linking each part in order with keywords.

National Air Quality Index, AQI, Range, Pollutants, Calculation

National Air Quality Index

Air pollution has emerged as a major public health and environmental challenge, especially in rapidly urbanising regions. Communicating complex air pollution data to the public in a simple and meaningful manner is essential for awareness, prevention, and policy response. To address this need, an index based system was developed that converts multiple pollutant concentrations into a single understandable number, enabling citizens, administrators, and health agencies to assess air quality conditions quickly and make informed decisions.

National Air Quality Index

The National Air Quality Index is a standardized tool introduced in India to present real time air quality information in an easily interpretable form. It was launched nationally in September 2014 and follows the principle of “one number, one colour, one description” to communicate pollution levels and associated health risks. It integrates scientific monitoring with public communication, supporting clean air initiatives and environmental governance across urban and semi urban regions.

Also Read: Air Pollution

Air Quality Index (AQI)

Air Quality Index is a numerical scale that represents overall air pollution levels by converting measured concentrations of multiple air pollutants into a single value.

  • Purpose of AQI: It simplifies large volumes of air quality data into a single index value to improve public understanding and risk communication.
  • Health Based Framework: AQI values are linked with epidemiological evidence to reflect potential short term health impacts of pollutant exposure.
  • Colour and Category System: Each AQI range is associated with a specific colour and descriptor indicating pollution severity and health concern levels.
  • Short Term Exposure Focus: AQI primarily reflects short term exposure risks using 24 hour averages, ensuring relevance for daily public health advisories.
  • Global Practice: Different countries adopt AQI systems aligned with their national air quality standards, though pollutants and breakpoints vary.

National Air Quality Index Pollutants

The National Air Quality Index is based on eight key pollutants with established short term National Ambient Air Quality Standards.

  1. PM 10: Coarse particulate matter below 10 micrometres originates from dust, construction, and natural sources, causing respiratory irritation on prolonged exposure.
  2. PM 2.5: Fine particulate matter below 2.5 micrometres penetrates deep into lungs and bloodstream, significantly increasing cardiovascular and respiratory disease risks.
  3. Nitrogen Dioxide (NO₂): Emitted mainly from vehicle exhaust and power plants, it worsens asthma and contributes to ground level ozone formation.
  4. Sulphur Dioxide (SO₂): Released from coal based power generation and smelting, it irritates airways and contributes to acid deposition.
  5. Carbon Monoxide (CO): A toxic gas from incomplete fuel combustion that reduces oxygen delivery in the bloodstream, affecting vital organs.
  6. Ozone (O₃): A secondary pollutant formed by photochemical reactions, causing chest discomfort and lung inflammation during high exposure periods.
  7. Ammonia (NH₃): Predominantly from agricultural activities, it contributes to secondary particulate formation and respiratory irritation.
  8. Lead (Pb): A neurotoxic heavy metal affecting cognitive development, especially harmful to children, sourced from smelters and battery manufacturing.

Also Read: Environmental Pollution

National Air Quality Index Range

The National Air Quality Index classifies air quality into six health based categories using numerical ranges and pollutant concentration thresholds.

  1. Good (0 to 50): Air quality poses minimal health risk, with pollutant concentrations well within national standards.
  2. Satisfactory (51 to 100): Minor breathing discomfort may occur among unusually sensitive individuals.
  3. Moderately Polluted (101 to 200): Increased respiratory discomfort observed in children, elderly, and people with lung or heart conditions.
  4. Poor (201 to 300): Prolonged exposure can cause breathing difficulty and aggravate existing respiratory and cardiovascular diseases.
  5. Very Poor (301 to 400): Extended exposure significantly increases risk of respiratory illness, particularly in vulnerable populations.
  6. Severe (401 to 500): Even healthy individuals experience adverse health impacts, while those with existing diseases face serious complications.

National Air Quality Index Calculation

The National Air Quality Index is computed using pollutant wise sub indices derived from monitored concentrations and predefined health breakpoints.

  • Sub Index Calculation: Each pollutant’s measured concentration is converted into a sub index using a linear interpolation based on health based breakpoint ranges.
  • Worst Pollutant Principle: The highest sub index among all monitored pollutants determines the overall National Air Quality Index value for that location.
  • Data Averaging Period: Most pollutants use 24 hour average concentrations, while carbon monoxide and ozone use 8 hour average values.
  • Minimum Data Requirement: AQI is calculated only when data for at least three pollutants is available, including either PM 2.5 or PM 10 compulsorily.
  • Real Time Dissemination: Continuous monitoring stations generate AQI automatically using running averages without manual intervention.
  • Manual Monitoring Support: An AQI calculator allows manual data entry for locations lacking continuous analysers to generate standardized AQI values.

National Air Quality Index Limitation

Despite its effectiveness, the National Air Quality Index has technical and operational limitations affecting accuracy and continuity.

  • Sensor Dependency: AQI accuracy depends on analyser calibration, sensor reliability, and uninterrupted power supply at monitoring stations.
  • Data Gaps: Power outages, internet failures, and maintenance issues can disrupt continuous data transmission and AQI dissemination.
  • Preliminary Data Use: Real time AQI uses raw analyser data without validation, making it unsuitable for regulatory or legal enforcement.
  • Limited Coverage: Continuous real time monitoring is operational only in selected cities, leaving many regions dependent on manual stations.
  • Pollutant Exclusion: Several harmful air pollutants lack defined AQI sub indices and are therefore excluded from public reporting.

National Air Quality Index FAQs

Q1: What is the National Air Quality Index?

Ans: It is a tool that converts air pollution data into a single number to show overall air quality and health risk.

Q2: When was the National Air Quality Index launched in India?

Ans: It was launched nationwide in September 2014 by the Ministry of Environment, Forest and Climate Change.

Q3: How many pollutants are included in the National Air Quality Index?

Ans: Eight pollutants are considered, including PM 2.5, PM 10, NO₂, SO₂, CO, O₃, NH₃, and Lead.

Q4: Which pollutant decides the final AQI value?

Ans: The pollutant with the highest sub index value determines the overall National Air Quality Index.

Q5: Is National Air Quality Index data used for legal action?

Ans: No, real time AQI data is indicative and not used for regulatory or legal enforcement purposes.

Martial Law in India, Meaning, Constitutional Provisions, Article 34

Martial Law in India

Martial Law in India refers to a situation where the civil administration is replaced by military authority due to an extreme breakdown of law and order. It is generally imposed during war, armed rebellion, or severe internal disturbances when ordinary laws are insufficient to maintain public order. Under Martial Law, the military takes control of governance, and civilians may be tried in military courts.

Martial Law in India

India has never officially declared Martial Law at the national level after independence. However, limited forms of military control resembling Martial Law have been observed in disturbed areas, especially during insurgencies or extreme security situations. In such cases, the armed forces assist civil authorities but do not completely replace the civilian government.

The Indian democratic framework strongly emphasizes civil supremacy over the military. Therefore, Martial Law is viewed as a last resort, and its use is restrained by constitutional values, judicial review, and fundamental rights protection.

Martial Law Provisions in Indian Constitution

The Indian Constitution does not explicitly define or mention the term Martial Law. However, it indirectly recognizes the concept by allowing the military to assist civil authorities during extreme breakdowns of law and order.

  • Article 34 empowers Parliament to indemnify persons for acts done in connection with the maintenance or restoration of order when martial law is in force.
  • Fundamental Rights may be restricted or suspended in practice during martial law due to military control.
  • The authority and scope of martial law depend on Parliamentary laws and military necessity, not constitutional proclamation.

Differences between Martial Law and National Emergency

The differences between Martial Law and National Emergency are explained in the table below:

Differences between Martial Law and National Emergency
Basis of Difference Martial Law National Emergency

Constitutional Status

Not explicitly mentioned in the Constitution

Clearly defined under Article 352

Authority Exercised

Military authority replaces civil administration

Civil government continues with expanded powers

Scope

Limited to specific disturbed areas

Can be imposed on the entire country or part of it

Fundamental Rights

May be suspended or severely restricted

Article 19 automatically suspended; others as per law

Role of Judiciary

Courts may be restricted or replaced by military courts

Judiciary continues to function

Parliamentary Approval

Not mandatory

Mandatory within one month

Nature

Extra-constitutional and exceptional

Constitutional and regulated

Objective

Restore law and order through military control

Protect sovereignty, unity, and security of India

Martial Law in India FAQs

Q1: Is Martial Law mentioned in the Indian Constitution?

Ans: No, Martial Law is not explicitly defined in the Constitution. It is only indirectly referred to under Article 34.

Q2: Has Martial Law ever been imposed in India?

Ans: India has never formally declared Martial Law nationwide. However, military assistance to civil authorities has been provided in disturbed areas.

Q3: Who has the power to impose Martial Law in India?

Ans: There is no clearly defined authority in the Constitution. It is generally imposed when civil administration collapses and military control becomes necessary.

Q4: How is Martial Law different from Emergency?

Ans: Martial Law involves direct military rule, while Emergency allows the civilian government to function with enhanced powers.

Q5: Can Fundamental Rights be suspended during Martial Law?

Ans: Yes, Fundamental Rights may be restricted or suspended depending on the situation, subject to parliamentary indemnity under Article 34.

Difference Between FDI, FPI and FII, Definition, Control, Risk

Difference Between FDI, FPI and FII

Foreign Direct Investment (FDI), Foreign Portfolio Investment (FPI), and Foreign Institutional Investors (FII) are different forms of foreign capital inflow. FDI involves long-term investment with ownership and management control in businesses and infrastructure. FPI refers to investment in financial instruments like shares and bonds without any control over management and is generally short-term in nature. FII represents foreign institutional entities such as pension funds and mutual funds that invest in a country’s financial markets, making FDI the most stable and FPI/FII more market-sensitive.

The Difference Between FDI, FPI, and FII has been discussed below in detail.

Foreign Direct Investment (FDI)

Foreign Direct Investment (FDI) refers to an investment made by a foreign individual or company in the business activities of another country with the objective of long-term interest and management control. It is a non-debt source of capital, meaning it does not create repayment obligations.

  • FDI involves ownership of 10% or more equity in an enterprise, which allows the foreign investor to influence management decisions.
  • It focuses on long-term investment rather than short-term financial gains.
  • FDI contributes to job creation, skill development, and technological advancement in the host country.
  • It brings capital inflow along with global best practices in management and production.
  • FDI is considered a stable source of foreign investment compared to portfolio investments.
  • In India, FDI is permitted through the Automatic Route and Government Route.
  • FDI is regulated under the Foreign Exchange Management Act (FEMA) by the RBI and DPIIT.
  • Major sectors receiving FDI in India include manufacturing, services, infrastructure, telecom, and renewable energy.

Foreign Portfolio Investment (FPI)

Foreign Portfolio Investment (FPI) refers to investment made by foreign investors in the financial assets of another country, such as shares, bonds, government securities, mutual funds, and exchange-traded funds. These investments are made without any intention of gaining management control, and the main objective is to earn short-term or medium-term financial returns.

  • FPI involves investment only in financial instruments, not in physical assets or businesses.
  • Investors have no ownership or managerial control over the companies they invest in.
  • FPI is highly liquid, allowing easy entry and exit from the market.
  • These investments are sensitive to global economic factors such as interest rates, inflation, and geopolitical events.
  • FPI helps in increasing liquidity and depth of capital markets.
  • In India, FPIs are regulated by the Securities and Exchange Board of India (SEBI) under FEMA.
  • Investments by Non-Resident Indians (NRIs) are not classified as FPI.
  • Sudden inflows or outflows of FPI can impact stock market stability and exchange rates.

Foreign Institutional Investor (FII)

A Foreign Institutional Investor (FII) refers to a foreign-based institutional entity that invests in the financial markets of a country other than where it is registered or headquartered. FIIs include pension funds, mutual funds, insurance companies, hedge funds, investment banks, and asset management companies. These investors primarily aim to earn returns through equity and debt market investments rather than acquiring management control.

  • FIIs are institutions, not individuals, investing in foreign financial markets.
  • They mainly invest in shares, bonds, government securities, and derivatives.
  • FIIs do not exercise managerial control over the companies they invest in.
  • Their investment decisions are highly influenced by global economic conditions and market sentiment.
  • FIIs play a major role in improving liquidity and depth of capital markets.
  • In India, FIIs are regulated by SEBI, with RBI monitoring investment limits under FEMA.
  • There are investment ceilings to prevent excessive influence, such as a maximum of 10% investment by a single FII in one company.
  • FIIs are now legally covered under the Foreign Portfolio Investment (FPI) framework, though the term FII is still commonly used in exams and media.

Difference Between FDI, FPI and FII

The Difference Between FDI, FPI, and FII have been tabulated below based on different aspects. 

Difference Between FDI, FPI and FII
Aspect FDI (Foreign Direct Investment) FPI (Foreign Portfolio Investment) FII (Foreign Institutional Investor)

Definition

Investment in physical assets like businesses, industries, or infrastructure in a foreign country.

Investment in financial assets like shares, bonds, mutual funds, or ETFs in a foreign country.

Institutional investors such as pension funds, mutual funds, or hedge funds investing in a country’s financial markets.

Nature of Investment

Long-term investment aimed at acquiring ownership and management control.

Short-term or medium-term investment primarily for financial gains.

Typically longer than FPI but shorter than FDI, focused on portfolio diversification and profit-making.

Control

Provides significant control and influence over the management of the invested company.

Does not provide control over the company or its management.

No management control; focuses solely on portfolio returns.

Risk Involved

High risk due to long-term commitment and exposure to market and regulatory conditions.

Comparatively lower risk due to ease of entry and exit.

Risk depends on market conditions and capital flow policies; can be highly volatile.

Impact on Economy

Leads to job creation, technology transfer, and infrastructure development.

Provides liquidity and stability to financial markets.

Boosts stock market liquidity; impact is mostly limited to financial market activities.

Regulation in India

Governed by FDI Policy and controlled by DPIIT under FEMA.

Regulated by SEBI under FPI norms and FEMA.

Registered with SEBI and monitored by RBI; must follow FII regulations.

Liquidity

Low liquidity due to physical nature of assets and long-term involvement.

High liquidity as financial assets can be easily sold.

High liquidity, similar to FPIs; easy to enter or exit the market.

Difference Between FDI, FPI and FII FAQs

Q1: What is the basic difference between FDI, FPI and FII?

Ans: FDI involves long-term ownership and control, FPI involves short-term financial investment without control, and FII refers to foreign institutions investing in financial markets.

Q2: Which is more stable for the Indian economy, FDI or FPI?

Ans: FDI is more stable for the Indian economy because it creates assets, jobs, and long-term growth.

Q3: Do FPI and FII investors have management control over companies?

Ans: No, FPI and FII investors do not have management control over the companies they invest in.

Q4: Are FII and FPI the same in India?

Ans: In India, FIIs are legally classified under the FPI framework as per SEBI regulations.

Q5: Who regulates FDI, FPI and FII in India?

Ans: FDI is regulated by RBI and DPIIT, while FPI and FII are regulated by SEBI.

Miniratna Companies in India, Category I & II, List, Eligibility

Miniratna Companies in India

Miniratna Companies in India are a key tier of Central Public Sector Enterprises (CPSEs) that have demonstrated consistent profitability and financial stability. Created to give capable public firms more operational freedom, Miniratnas (Category I and II) enjoy defined financial autonomy so they can make capital investments and manage projects without repeated central approvals. These companies support regional economies, provide employment, and act as testing grounds for managerial autonomy before firms move up to Navratna or Maharatna status. Understanding Miniratna Companies in India explains how the state balances control with enterprise-level flexibility.

Miniratna Companies in India

Miniratna Companies in India are profit-making CPSEs split into Category I and II. Category I firms can incur capital expenditure up to ₹500 crore (or up to their net worth) while Category II firms have a lower investment ceiling (up to ₹300 crore or up to 50% of net worth). The status rewards sustained profits, positive net worth, and financial independence, and is granted by the Department of Public Enterprises (DPE).

Also Read: Maharatna Companies in India

Miniratna Companies in India Need

The Miniratna scheme was introduced to grant capable PSUs graded autonomy and encourage improved performance and faster decision-making.

  • After reforms of the 1990s and the need to make PSUs competitive, the government created graded autonomy for well-performing units.
  • Miniratna status recognizes consistent profit-making PSUs and allows them operational leeway without frequent central clearances.
  • It creates a growth pathway: from Miniratna → Navratna → Maharatna, aligning performance incentives with greater financial powers.
  • The scheme also reduces administrative bottlenecks, enabling faster project execution and local decision-making.

Miniratna Companies in India Historical Background

Miniratna status was created in 1997 to give financially solid PSUs autonomy and stronger financial powers. 

  • In October 1997, the Department of Public Enterprises (DPE) issued an order granting financial and operational autonomy to profit-making PSUs via the Miniratna scheme. 
  • The original DPE OM (Office Memorandum) defined two Miniratna categories (I & II), based on profitability and net worth criteria. 
  • By 2003, Miniratna CPSEs were allowed larger delegated financial powers, enabling substantial capital expenditure without seeking explicit government approval. 
  • The PSU reform aimed to make public companies more competitive and efficient, particularly in global or commercial arenas. 
  • The DPE periodically reviews Miniratna performance, with guidelines updated to reflect changing economic requirements.

Miniratna Category I 

Miniratna Category I companies are CPSEs that have recorded profits for the last three consecutive years and have earned a pre-tax profit of at least ₹30 crore in one of those years, with a positive net worth. Once granted Category I status, a company can undertake capital expenditure up to ₹500 crore or up to its net worth (whichever is lower) without seeking prior government approval. This status gives medium-level autonomy aimed at supporting growth and project execution.

Miniratna Category II

Miniratna Category II companies are CPSEs that have also been profitable for three consecutive years and possess a positive net worth but fall short of the Category I financial thresholds. Category II firms are allowed to approve capital expenditure proposals up to ₹300 crore or up to 50% of their net worth (whichever is lower). The Category II tag is designed for smaller but steady PSUs to manage their operations with reasonable autonomy.

Also Read: Navratna Companies in India

Miniratna Companies in India List

As of 2026, official tallies vary slightly across sources because of recent upgrades and reclassifications, but authoritative compilations indicate roughly 74 Miniratna companies across Category I and II. Names of the Miniratna companies include:

Miniratna Category I Companies

The List of Category I Miniratna Companies in India has been tabulated below based on the recent addition as of 2025, comprising total 62 companies:

Category I Miniratna Companies in India
S. No. Company Name
1 Airports Authority of India
2 Antrix Corporation Limited
3 Balmer Lawrie & Co. Limited
4 Bharat Coking Coal Limited
5 Bharat Dynamics Limited
6 BEML Limited
7 Bharat Sanchar Nigam Limited
8 Braithwaite & Company Limited
9 Bridge & Roof Company (India) Limited
10 Central Warehousing Corporation
11 Central Coalfields Limited
12 Central Mine Planning & Design Institute Limited
13 Chennai Petroleum Corporation Limited
14 Cochin Shipyard Limited
15 Cotton Corporation of India Ltd.
16 EdCIL (India) Limited
17 Garden Reach Shipbuilders & Engineers Limited
18 Goa Shipyard Limited
19 Hindustan Copper Limited
20 HLL Lifecare Limited
21 Hindustan Newsprint Limited
22 Hindustan Paper Corporation Limited
23 Housing & Urban Development Corporation Limited
24 HSCC (India) Limited
25 India Tourism Development Corporation Limited
26 Indian Rare Earths Limited
27 Indian Railway Catering & Tourism Corporation Limited
28 Indian Railway Finance Corporation Limited
29 Indian Renewable Energy Development Agency Limited
30 India Trade Promotion Organization
31 IRCON International Limited
32 KIOCL Limited
33 Mazagaon Dock Shipbuilders Limited
34 Mahanadi Coalfields Limited
35 MOIL Limited
36 Mangalore Refinery & Petrochemical Limited
37 Mineral Exploration Corporation Limited
38 Mishra Dhatu Nigam Limited
39 MMTC Limited
40 MSTC Limited
41 National Fertilizers Limited
42 National Projects Construction Corporation Limited
43 National Small Industries Corporation Limited
44 National Seeds Corporation
45 NHPC Limited
46 Northern Coalfields Limited
47 North Eastern Electric Power Corporation Limited
48 Numaligarh Refinery Limited
49 ONGC Videsh Limited
50 Pawan Hans Helicopters Limited
51 Projects & Development India Limited
52 RailTel Corporation of India Limited
53 Rail Vikas Nigam Limited
54 Rashtriya Chemicals & Fertilizers Limited
55 RITES Limited
56 SJVN Limited
57 Security Printing and Minting Corporation of India Limited
58 South Eastern Coalfields Limited
59 Telecommunications Consultants India Limited
60 THDC India Limited
61 Western Coalfields Limited
62 WAPCOS Limited

Miniratna Category II Companies

The List of Category II Miniratna Companies in India has been tabulated below based on the recent addition as of 2025, comprising total 12 companies:

Category II Miniratna Companies in India
S. No. Company Name
1 Artificial Limbs Manufacturing Corporation of India
2 Bharat Pumps & Compressors Limited
3 Broadcast Engineering Consultants India Limited
4 Central Railside Warehouse Company Limited
5 Engineering Projects (India) Limited
6 FCI Aravali Gypsum & Minerals India Limited
7 Ferro Scrap Nigam Limited
8 HMT (International) Limited
9 Indian Medicines & Pharmaceuticals Corporation Limited
10 MECON Limited
11 National Film Development Corporation Limited
12 Rajasthan Electronics & Instruments Limited

Miniratna Companies in India Eligibility Criteria

Eligibility to be designated a Miniratna in India rests on sustained profitability, positive net worth and clean financial records.

  • Category I: Profitability for three consecutive years; pre-tax profit of ≥ ₹30 crore in at least one of those years; positive net worth; no defaults on government loans.
  • Category II: Profitability for three consecutive years and positive net worth; fewer financial thresholds than Category I but must show independent viability.
  • Other conditions: CPSE must not depend on government budgetary support for past three years and should have a satisfactory track record on statutory compliances.

Miniratna Companies in India Benefits

Miniratna status grants financial powers and faster decision-making that help companies invest, undertake projects, and form joint ventures.

  • Category I benefits: Can approve capital expenditure up to ₹500 crore or up to their net worth; faster project sanction; greater ability to form joint ventures and subsidiaries.
  • Category II benefits: Can approve capital expenditure up to ₹300 crore or up to 50% of net worth; flexibility in operational expenditure; improved procurement autonomy.
  • Common gains: Reduced administrative delay, motivation for managers, and capacity to respond to market opportunities quickly, improving competitiveness.

Miniratna Companies in India Impact

Miniratna firms strengthen regional industries, deliver services efficiently, and act as feeders to higher 'Ratna' categories.

  • Category I impact: Typically lead investments in region-specific infrastructure projects, expand manufacturing capability and contribute significant revenues to exchequer.
  • Category II impact: Support local economies, maintain service delivery (like ports, airports, utilities), and stabilise employment in specialized sectors.
  • Broader impact: Collectively, Miniratna companies raise PSU efficiency, reduce procedural bottlenecks and help the government achieve social and economic objectives.

Miniratna Companies in India Significance

Miniratnas are significant because they combine public ownership with managerial freedom to drive growth, accountability and market responsiveness.

  • Category I significance: Trusted with larger investments, they test governance reforms and are candidates for future Navratna upgrades.
  • Category II significance: Provide an incubation stage for smaller PSUs to build financial strength and governance maturity.
  • Systemic significance: They reduce the need for central approvals, making PSUs nimbler while retaining public accountability.

Miniratna Companies in India Contributions

Miniratnas contribute to national revenue, regional employment, and capital formation through profits, taxes, and reinvestment.

  • Miniratna firms form part of the larger CPSE revenue pool; CPSUs together reported large revenues in recent years (trillions INR collectively).
  • Miniratna profits are used for capital expenditure, dividends to government, and workforce development.

Miniratna Companies in India Recent Developments

Policy reviews in 2024-25 propose revising Ratna criteria and adding new Ratna categories for next-gen CPSEs.

  • The government is revising CPSE classification norms; a committee led by senior officials is exploring new evaluation parameters including corporate governance, capital expenditure, succession planning and sustainability to realign Ratna status with Vision 2047 ambitions.
  • Recent PIB releases show fresh grants of Miniratna status (e.g., Munitions India Ltd, Armoured Vehicles Nigam Ltd, India Optel Ltd granted Miniratna in May 2025), reflecting dynamic recognition of performance across sectors.
  • These changes aim to sharpen incentives, reward governance, and produce globally competitive CPSEs.

Miniratna Companies in India Challenges

Miniratna firms face governance gaps, limited access to capital markets, outdated assets, and capacity constraints needing policy attention.

  1. Limited scale compared with Navratna/Maharatna restricts strategic investments.
  2. Legacy systems and aging plant & machinery reduce competitiveness.
  3. Bureaucratic hurdles still persist despite autonomy limits.
  4. Difficulty in attracting professional private-sector managerial talent.
  5. Access to low-cost long-term capital remains constrained.
  6. Need for stronger corporate governance and succession planning.
  7. Vulnerability to market shocks and sectoral downturns.
  8. Limited R&D and innovation budgets.
  9. Overlap of commercial and social objectives can dilute focus.
  10. Slow pace in converting profitable Miniratnas to Navratna despite potential.

Way Forward:

  1. Revise evaluation metrics to reward sustainability, capex and governance.
  2. Facilitate blended finance and long-term lending for modernization.
  3. Promote strategic public-private partnerships for tech upgrades.
  4. Institute leadership development and professional board practices.
  5. Encourage R&D through matched funds and innovation clusters.
  6. Fast-track corporatisation of strategic units with clear commercial mandates.
  7. Use performance-based incentives for promotions to Navratna.
  8. Strengthen market access and export promotion for Miniratnas.
  9. Improve transparency with public dashboards and regular audits.
  10. Align Miniratna strategy with national priorities like energy transition and Make-in-India.

Miniratna Companies in India UPSC 

Miniratna Companies in India occupy an important middle ground in India’s public enterprise architecture. By granting calibrated financial autonomy, the Miniratna scheme empowers profitable, smaller CPSEs to invest, innovate and respond quickly to market opportunities while retaining public ownership and social obligations. Recent rounds of grants and policy reviews show the government’s intent to make the Ratna framework fit modern priorities, governance, sustainability and global competitiveness. With focused reforms on finance, governance and capacity building, Miniratna Companies in India can become reliable engines of regional development and stepping stones to larger statuses like Navratna and Maharatna. 

Miniratna Companies in India FAQs

Q1: What are Miniratna Companies in India?

Ans: Miniratna Companies in India are profit-making CPSEs given limited financial autonomy under two categories to speed decision-making and investment.

Q2: What is the eligibility for Miniratna Companies in India (Category I)?

Ans: Category I Miniratna Companies in India must be profitable for 3 years and have at least ₹30 crore pre-tax profit in one of those years, plus positive net worth.

Q3: What financial powers do Miniratna Companies in India enjoy?

Ans: Miniratna Companies in India (Category I) can approve capital expenditure up to ₹500 crore or their net worth; Category II up to ₹300 crore or 50% net worth.

Q4: How many Miniratna Companies in India exist?

Ans: There are about 74 Miniratna Companies in India.

Q5: Why are Miniratna Companies in India important?

Ans: Miniratna Companies in India balance public ownership with enterprise autonomy, enabling regional growth, faster investments, and a pipeline for higher Ratna statuses.

Village Defence Guards, Objectives, Role in Internal Security

Village Defence Guards

Village Defence Guards (VDGs) are community-based security volunteers deployed primarily in vulnerable and border regions to assist formal security forces. They act as the first line of defence against terrorism, infiltration, and local security threats. VDGs strengthen grassroots security by involving local citizens in safeguarding their villages. The concept has gained renewed importance in India’s internal security framework, especially in Jammu & Kashmir.

What are Village Defence Guards?

Village Defence Guards are trained civilian volunteers authorized to support police and security forces in maintaining law and order at the village level. They are usually provided with basic arms and security training to counter terrorist threats. VDGs function as an auxiliary force, not as a replacement for the police or armed forces. Their role is preventive, defensive, and intelligence-oriented.

Village Defence Guards Objectives

  • Protection of Villages: Safeguard villages, especially in border and remote areas, from terrorist attacks, infiltration, and criminal activities.
  • Early Warning Mechanism: Act as the first responders by identifying and reporting suspicious movements or security threats at the local level.
  • Support to Security Forces: Assist police, Army, and paramilitary forces during search operations, patrols, and emergencies.
  • Community Participation in Security: Encourage active involvement of local residents in maintaining law and order and village security.
  • Intelligence Gathering: Provide ground-level intelligence due to their familiarity with local terrain, routes, and population.
  • Deterrence Against Terrorism: Create a psychological deterrent against terrorists and anti-national elements through local vigilance.
  • Strengthening Internal Security: Act as force multipliers to enhance the overall internal security framework of the region.

Village Defence Guards Composition

  • Local Civilians: Mainly villagers from identified vulnerable areas who are familiar with the terrain and local population.
  • Ex-Servicemen: Retired personnel from the Army, Central Paramilitary Forces (CPMF), or J&K Police to provide experience and leadership.
  • Group Size: Each Village Defence Group consists of up to 15 members.
  • Leadership: Each group is headed by a retired officer from the Army, CPMF, or J&K Police.
  • Selection Process: Members are selected at the panchayat level based on recommendations and law enforcement assessment.
  • Training: Members receive basic arms training and security skills from the CRPF or Army.
  • Operational Control: VDGs function under the supervision of the District SP or SSP, ensuring coordination with formal security forces.
  • Eligibility for Remuneration: All members, including the group head, are paid monthly to maintain motivation and continuity.

Role of VDGs in Internal Security and Counter-Terrorism

  • First Line of Local Defence: VDGs act as the first responders in vulnerable villages where quick police or army deployment is difficult due to terrain or distance, helping deter surprise terrorist attacks. 
  • Intelligence Gathering: Their familiarity with local terrain and population enables them to identify and report suspicious movements and infiltration attempts, aiding security forces with timely information. 
  • Supporting Security Operations: They assist police and paramilitary units in search‑and‑cordon operations, perimeter security, and coordinated responses, acting as force multipliers.
  • Enhanced Armed Capability: VDGs are equipped with modern weapons such as Self‑Loading Rifles (SLRs) instead of outdated .303 rifles, strengthening their capability to counter armed threats.
  • Training by Security Forces: Members receive training from the Indian Army and CRPF in weapon handling, tactics, and surveillance to improve operational readiness in counter‑terrorism contexts. 
  • Data on Engagement: As per the Ministry of Home Affairs report, there are 4,153 Village Defence Groups (VDGs) active in Jammu & Kashmir, working alongside 32,355 Special Police Officers (SPOs) in varied roles including anti‑terror protection. 

VDGs in Jammu & Kashmir Strategic Significance

  • Border and Remote Area Security: VDGs protect villages located near the Line of Control (LoC) and other vulnerable border regions, acting as the first line of defence against infiltration and militant attacks.
  • Force Multiplier for Security Forces: By assisting police, CRPF, and Army units in patrols, search-and-cordon operations, and emergency response, VDGs extend the operational reach of formal security forces in difficult terrains.
  • Rapid Intelligence Gathering: Being locals, VDGs provide timely intelligence about suspicious movements, weapons smuggling, or potential threats, improving counter-terrorism efficiency.
  • Community Integration and Trust: Their presence strengthens civilian cooperation with security agencies, fostering community-based vigilance and resilience against extremist elements.
  • Protection of Key Infrastructure: VDGs safeguard villages, religious sites, schools, and critical public infrastructure, reducing the risk of sabotage or attacks on civilians.
  • Psychological Deterrence: The visible deployment of VDGs discourages militants and anti-national actors from operating freely in remote areas.

Way Forward

To enhance the effectiveness of Village Defence Guards and strengthen grassroots security, several measures can be considered:

  • Enhanced Training: Regular and advanced training programs should be provided, including modern counter-terrorism techniques, surveillance, and digital reporting tools, to improve operational readiness.
  • Modern Equipment and Arms: VDGs should be equipped with modern firearms, protective gear, and communication devices to handle evolving security threats effectively.
  • Welfare and Remuneration: Timely payment of salaries, insurance coverage, and other welfare measures will boost morale, retention, and professionalism among VDG members.
  • Clear Standard Operating Procedures (SOPs): Well-defined operational guidelines and coordination mechanisms with police and paramilitary forces will ensure accountability and efficiency during operations.
  • Community Engagement: Continuous awareness campaigns and local cooperation can strengthen community-based vigilance and improve intelligence inputs.

Technology Integration: Use of drones, surveillance cameras, and GIS-based monitoring can enhance real-time intelligence and response capabilities.

Village Defence Guards FAQs

Q1: What are Village Defence Guards (VDGs)?

Ans: Village Defence Guards are armed civilian volunteers deployed in vulnerable villages, primarily in Jammu & Kashmir, to assist security forces in counter-terrorism, village protection, and intelligence gathering.

Q2: When were VDGs launched?

Ans: VDGs were formally approved by the Union Ministry of Home Affairs (MHA) in March 2022, replacing and restructuring the earlier Village Defence Committees (VDCs) that were set up in the 1990s.

Q3: What is the composition of a Village Defence Group?

Ans: Each Village Defence Group typically consists of up to 15 members, including ex-servicemen and trained local civilians.

Q4: What are the primary roles of VDGs?

Ans: VDGs conduct day-night patrols, protect villages, religious places, and public infrastructure, assist in search-and-cordon operations, and provide local intelligence to security forces.

Q5: Under whose supervision do VDGs operate?

Ans: VDGs function under the District Superintendent of Police (SP) or Senior Superintendent of Police (SSP), ensuring coordination with formal security forces and accountability.

Deputy Prime Minister of India, List, Tenure, Political Party

Deputy Prime Minister of India

As of 2026, India does not have a Deputy Prime Minister. The position is not a permanent constitutional post and is appointed only when required by the government. Over the years, only a few leaders have held this title, such as Sardar Vallabhbhai Patel, Morarji Desai, and L. K. Advani. The last person to serve as Deputy Prime Minister of India was L. K. Advani from 2002 to 2004.

Deputy Prime Minister of India

The Deputy Prime Minister of India isn’t a constitutional post, it’s purely political, created and used at the Prime Minister’s decision. Over the years, it’s been given to senior leaders in the Cabinet to recognize their influence or help manage major portfolios. While there’s no official job description in the Constitution, the Deputy Prime Minister of India is usually seen as the second-most important person in the government, right after the Prime Minister. This role becomes especially significant in coalition governments. It helps keep alliance partners satisfied and provides a sense of balance in power-sharing.

List of Deputy Prime Minister of India

India does not have a Deputy Prime Minister. The position has remained vacant since May 23, 2004, after Lal Krishna Advani last held the role. Since independence, only a few leaders have served as Deputy Prime Minister of India, and each did so under specific political circumstances. Here’s a complete List of Deputy Prime Minister of India, along with their tenure and the key portfolios they managed:

List of Deputy Prime Minister of India
S.No. Name Tenure Political Party Notable Facts

1

Vallabhbhai Patel

15 Aug 1947 – 15 Dec 1950

Indian National Congress

First DPM; longest-serving; integrated princely states into India

2

Morarji Desai

13 Mar 1967 – 19 Jul 1969

Indian National Congress

Later became PM; known for economic policies

3

Charan Singh

24 Jan 1979 – 16 Jul 1979

Janata Party

Later became PM; advocated agricultural reforms

4

Jagjivan Ram

24 Jan 1979 – 28 Jul 1979

Indian National Congress

Prominent Dalit leader, Minister of Defence

5

Yashwantrao Chavan

28 Jul 1979 – 14 Jan 1980

Indian National Congress (Urs)

Minister of Home Affairs, internal security role

6

Devi Lal

2 Dec 1989 – 1 Aug 1990

Janata Dal

Focused on agricultural reforms

7

Devi Lal

10 Nov 1990 – 21 Jun 1991

Samajwadi Janata Party (Rashtriya)

Second term as DPM

8

Lal Krishna Advani

28 Jun 2002 – 22 May 2004

Bharatiya Janata Party

Oversaw legislative reforms, Home Minister

Note: *Charan Singh served as Deputy Prime Minister under Morarji Desai and then became Prime Minister himself, with Jagjivan Ram as his Deputy Prime Minister for a brief period.

First Deputy Prime Minister of India

Sardar Vallabhbhai Patel was the First Deputy Prime Minister of India, serving from 15 August 1947 until his death on 15 December 1950. He held the crucial portfolio of Home Minister and played a defining role in integrating more than 560 princely states into the Indian Union after independence. He was known as the “Iron Man of India,” Patel earned this title through his resolute leadership and administrative clarity.

[my_image src="https://vajiramandravi.com/current-affairs/wp-content/uploads/2025/08/sardar-vallabhbhai-patel.webp" size="full" align="none" alt="sardar-vallabhbhai-patel" title="sardar-vallabhbhai-patel" width="auto" height="auto"]

Current Deputy Prime Minister of India

As of now, India doesn’t have a Deputy Prime Minister. The position has remained vacant since 2004, after the UPA government led by Dr. Manmohan Singh took office. Even under the current NDA government headed by Prime Minister Narendra Modi, no one has been appointed to the role.

At present, the Prime Minister oversees all key ministries directly, with support from the Cabinet. The Deputy Prime Minister of India is a powerful but non-constitutional post that has served both administrative and political purposes.

Also Check Related Post
Vice Presidents of India Education Ministers of India
Foreign Ministers of India Finance Ministers of India
Cabinet Ministers of India Prime Ministers of India
Deputy Prime Minister of India Presidents of India
Ministry of External Affairs

Deputy Prime Minister of India FAQs

Q1: How many Deputy Prime Ministers has India had?

Ans: India has had seven Deputy Prime Ministers since independence, though the post is not constitutionally mandated.

Q2: Who was the First Deputy Prime Minister of India?

Ans: Sardar Vallabhbhai Patel was First Deputy Prime Minister of India, serving from 1947 to 1950.

Q3: Who appoints the Deputy Prime Minister of India?

Ans: The Prime Minister may recommend a Deputy Prime Minister, who is then appointed by the President of India.

Q4: Is the Deputy Prime Minister post permanent?

Ans: No, it is not a constitutional post and is created at the discretion of the government.

Q5: Who was the last Deputy Prime Minister of India?

Ans: L. K. Advani was the last Deputy Prime Minister, serving from 2002 to 2004.

Five Year Plan in India, History, Objectives, Complete List

Five Year Plan in India

The Five Year Plan in India was a systematic approach to economic development introduced after Independence to ensure planned use of resources and balanced growth. India implemented twelve Five Year Plans between 1951 and 2017, covering agriculture, industry, infrastructure, education, and welfare sectors. The planning system was discontinued after the Twelfth Five-Year Plan, and a more flexible policy framework under NITI Aayog replaced it, as discussed in detail in the article below.

What is Five Year Plan in India?

The Five Year Plan in India was a centralized economic planning mechanism under which the government set specific economic, social, and developmental targets to be achieved over a period of five years.

The planning process was formulated and implemented by the Planning Commission of India, which was established in 1950. Each plan outlined sector-wise priorities such as agriculture, industry, education, health, infrastructure, and social justice, keeping in view the country’s developmental needs.

Five Year Plan in India History

India adopted the Five Year Plan model in 1951 to achieve planned economic development after Independence, inspired by the Soviet Union’s centralized planning system. The plans aimed to address poverty, low industrial base, and uneven development through systematic resource allocation.

  • Planning Commission was established in 1950 under the chairmanship of the Prime Minister
  • First Five Year Plan (1951-56) focused mainly on agriculture and irrigation
  • Early plans emphasized state-led industrialization and public sector growth
  • Plan Holiday (1966-69) occurred due to wars, droughts, and economic instability
  • Economic reforms in 1991 changed the planning approach toward liberalization
  • Twelfth Five Year Plan (2012-17) was the last plan before discontinuation
  • Planning Commission was replaced by NITI Aayog in 2015
  • Five Year Plans ended in 2017 to adopt a flexible and cooperative federal framework

Five Year Plan in India Objectives

The major objectives of the Five Year Plans in India were:

  • Economic Growth: Achieving rapid and sustained economic development by increasing national income and productivity.
  • Self-Reliance: Reducing dependence on imports and promoting domestic production, especially in key industries.
  • Social Justice: Reducing inequalities of income, wealth, and opportunities across regions and communities.
  • Poverty Alleviation: Addressing unemployment, poverty, and underdevelopment through targeted programs.
  • Balanced Regional Development: Ensuring equitable growth across states and backward regions.
  • Modernization: Promoting technological advancement, industrial diversification, and human capital development.

List of Five Year Plan in India

India implemented Twelve Five Year Plans between 1951 and 2017 to guide economic and social development in a planned manner. These plans were formulated by the Planning Commission and focused on areas such as agriculture, industrialisation, poverty reduction, and inclusive growth. The Twelfth Five-Year Plan (2012-17) was the last plan, after which the Planning Commission was replaced by NITI Aayog and the planning system was discontinued.

First Five-Year Plan (1951-56)

  • Marked the beginning of planned economic development in independent India, aiming to stabilise the economy after Partition.
  • Presented to Parliament by Jawaharlal Nehru, reflecting a mixed economy approach with state intervention.
  • K. N. Raj advocated a cautious growth path, arguing that India should “hasten slowly” to avoid inflation and instability.
  • Priority was given to agriculture, irrigation, and food security, as nearly 70% of the population depended on agriculture.
  • Large-scale investments were made in multipurpose river valley projects like Bhakra Nangal, Damodar Valley, and Hirakud.
  • Based on the Harrod-Domar Model, stressing capital formation through higher savings and investment.
  • Strengthened institutional framework by establishing five IITs to build technical manpower.
  • Target growth rate: 2.1% | Achieved growth rate: 3.6%, indicating strong early success.

Second Five-Year Plan (1956-61)

  • Shifted focus from agriculture to rapid industrialisation, especially heavy and capital goods industries.
  • Planned under P. C. Mahalanobis, whose model prioritised long-term industrial capacity over short-term consumption.
  • Emphasised development of public sector enterprises in steel, power, and machine tools.
  • Established major steel plants at Bhilai, Rourkela, and Durgapur, laying the foundation of industrial India.
  • Introduced import substitution by imposing high tariffs to protect domestic industries.
  • Faced challenges of inflation, balance of payments pressure, and limited foreign exchange.
  • Target growth rate: 4.5% | Actual growth rate: 4.27%.

Third Five-Year Plan (1961-66)

  • Aimed to make India a self-reliant economy with balanced growth of agriculture and industry.
  • Focused on wheat production, fertilisers, and agricultural expansion to reduce food imports.
  • Greater decentralisation, assigning states more responsibility for education and development.
  • Introduction of Panchayat elections strengthened democratic governance at the grassroots.
  • External shocks such as the 1962 China war, 1965 Pakistan war, and consecutive droughts disrupted the plan.
  • Severe fiscal stress and inflation led to poor outcomes.
  • Target growth rate: 5.6% | Actual growth rate: 2.4%, resulting in plan failure.

Plan Holidays (1966-69)

  • Implemented due to economic crisis following the failure of the Third Plan.
  • Consisted of three Annual Plans focusing on short-term stabilization.
  • Priority given to controlling inflation, food security, and restoring economic balance.

Fourth Five-Year Plan (1969-74)

  • Introduced under Indira Gandhi with an emphasis on correcting earlier distortions.
  • Based on the Gadgil Formula, ensuring balanced regional development.
  • Core objectives were growth with stability and self-reliance.
  • Nationalisation of 14 banks expanded institutional credit to agriculture and small industries.
  • Green Revolution significantly increased food grain production, especially wheat.
  • Launch of Drought Prone Area Programme (DPAP) to address regional vulnerabilities.
  • Target growth rate: 5.6% | Actual growth rate: 3.3%.

Fifth Five-Year Plan (1974-78)

  • Strongly focused on poverty alleviation and employment generation under the slogan Garibi Hatao.
  • Emphasised redistribution of income and reduction of inequalities.
  • Minimum Needs Programme (MNP) aimed at providing basic services like health, education, housing, and water.
  • Expansion of power sector after amendment of the Electricity Supply Act, 1975.
  • Development of the National Highway System to improve connectivity.
  • Target growth rate: 4.4% | Actual growth rate: 4.8%.
  • Discontinued in 1978 due to political change.

Rolling Plan (1978-80)

  • Introduced by the Janata Party government to ensure flexibility in planning.
  • Plans were revised annually based on performance evaluation.
  • Allowed adjustments in targets and resource allocation each year.
  • Abandoned after political transition in 1980.

Sixth Five-Year Plan (1980-1985)

  • Marked a major shift in India’s economic strategy, moving gradually from strict state control toward economic liberalisation.
  • Considered the end of Nehruvian Socialism, as price controls, licensing, and excessive regulation were reduced.
  • Focused on modernisation of industries, efficiency improvement, and technological upgradation.
  • Introduced family planning and population control measures to address demographic pressure on resources.
  • Strengthened rural and agricultural credit by establishing the National Bank for Agriculture and Rural Development (NABARD) in 1982, based on the Shivaraman Committee’s recommendations.
  • Prioritised development of energy, transport, and communication infrastructure to support industrial growth.
  • Encouraged greater participation of the private sector while retaining a strong public sector presence.
  • Target growth rate: 5.2%
  • Actual growth rate: 5.7%, making it one of the more successful Five Year Plans.

Seventh Five-Year Plan (1985-1990)

  • Implemented under the leadership of Prime Minister Rajiv Gandhi, focusing on technology-driven economic growth.
  • Emphasised modernisation of industries through the adoption of computers, electronics, and telecommunications.
  • Aimed to improve industrial productivity and efficiency, reducing reliance on outdated production methods.
  • Strengthened anti-poverty initiatives and welfare schemes to promote social justice.
  • Encouraged self-sustained economic growth, reducing long-term dependence on external assistance.
  • Laid emphasis on food grain production to ensure food security and price stability.
  • Promoted a shift towards a knowledge-based economy, laying groundwork for future IT sector growth.
  • Aimed to achieve the prerequisites for self-reliant growth by the year 2000.
  • Target growth rate: 5.0%
  • Actual growth rate: 6.01%, indicating robust economic performance.

Annual Plans (1990-1992)

  • The regular Five Year Plan framework was suspended due to political instability and severe economic crisis.
  • India faced an acute balance of payments and foreign exchange crisis, with reserves barely sufficient for a few weeks of imports.
  • High fiscal deficit, rising inflation, and declining industrial growth worsened economic conditions.
  • These years acted as a transition phase before comprehensive structural reforms.
  • Under Prime Minister P. V. Narasimha Rao, India initiated Liberalisation, Privatisation, and Globalisation (LPG) reforms.
  • Major measures included industrial delicensing, reduction in import tariffs, and encouragement of foreign investment.
  • The role of the private sector was expanded, while government control over the economy was reduced.

Eighth Five-Year Plan (1992-1997)

  • The first Five Year Plan implemented after the 1991 economic reforms.
  • Marked a decisive shift from centralised planning to a market-driven growth strategy.
  • Focused on modernisation of industries, improving efficiency, and global competitiveness.
  • Emphasised human resource development, especially in education, health, and skill formation.
  • Aimed to control population growth, reduce poverty, and generate employment opportunities.
  • Gave high priority to the development of infrastructure sectors such as power, roads, and telecommunications.
  • Encouraged private sector participation and foreign direct investment (FDI).
  • India became a member of the World Trade Organisation (WTO) in 1995, integrating with the global economy.
  • Target growth rate: 5.6%
  • Actual growth rate: 6.8%, reflecting strong economic performance.

Ninth Five-Year Plan (1997-2002)

  • Implemented during the period marking 50 years of Indian Independence.
  • Led under the Prime Ministership of Atal Bihari Vajpayee.
  • Theme of the plan was “Growth with Social Justice.”
  • Sought to balance rapid economic growth with improvement in quality of life.
  • Emphasised poverty eradication, human development, and social sector expansion.
  • Focused on empowering socially and economically backward classes.
  • Aimed to ensure universal access to primary education and improve health outcomes.
  • Encouraged public-private partnership (PPP) to accelerate economic development.
  • Target growth rate: 7.1%
  • Actual growth rate: 6.8%, slightly below expectations.

Tenth Five-Year Plan (2002-2007)

  • The Tenth Plan marked a clear shift towards inclusive and equitable economic growth.
  • Aimed at achieving an average annual GDP growth of 8%, focusing on both growth and distribution.
  • One of its key objectives was to reduce poverty by half during the plan period.
  • Targeted creation of 80 million employment opportunities, especially in agriculture, manufacturing, and services.
  • Emphasised reduction of regional disparities by promoting balanced development across states.
  • Focused on strengthening education, health, and skill development to improve human capital.
  • Sought to reduce gender inequality, particularly in education and wage employment.
  • Target growth rate: 8.1%
  • Actual growth rate: 7.6%, slightly below the target but considered relatively strong.

Eleventh Five-Year Plan (2007-2012)

  • The theme of the Eleventh Five-Year Plan was “Faster and More Inclusive Growth.”
  • Placed strong emphasis on social sector development, especially education, health, and skill formation.
  • Aimed to expand access to higher education, including universities, distance learning, and IT institutes.
  • The Right to Education Act (2009) was enacted, making free and compulsory education for children aged 6-14 years.
  • Focused on employment generation, particularly for youth, through skill development initiatives.
  • Sought to reduce poverty, gender inequality, and regional imbalances.
  • Emphasised environmental sustainability and sustainable use of natural resources.
  • Prepared under the leadership of C. Rangarajan.
  • Targeted provision of safe and clean drinking water for all.
  • Target growth rate: 9%
  • Actual growth rate: 8%, affected partly by the global financial crisis (2008).

Twelfth Five-Year Plan (2012-2017)

  • The Twelfth Plan was the last --Year Plan implemented in India.
  • Its theme was “Faster, More Inclusive and Sustainable Growth.”
  • Focused on strengthening infrastructure, including power, roads, railways, and urban development.
  • Aimed to ensure electricity access to all villages and improve energy efficiency.
  • Emphasised reducing social and gender gaps in school and higher education enrolment.
  • Promoted skill development and employment generation, especially in non-farm sectors.
  • Stressed environmental sustainability, with a target to increase green cover by 1 million hectares annually.
  • Encouraged innovation, improved governance, and better delivery of public services.

Initially targeted 9% growth, later revised to 8% by the National Development Council.

Five Year Plan in India FAQs

Q1: Who introduced the Five Year Plans in India?

Ans: The Five Year Plans were introduced by the Government of India with the establishment of the Planning Commission in 1950.

Q2: Which was the first Five Year Plan in India?

Ans: The First Five Year Plan was launched in 1951 under the leadership of Jawaharlal Nehru.

Q3: How many Five Year Plans were implemented in India?

Ans: India implemented 12 Five Year Plans between 1951 and 2017.

Q4: Why were Five Year Plans discontinued in India?

Ans: They were discontinued to adopt a more flexible, decentralized, and market-driven planning approach through NITI Aayog.

Q5: What replaced the Five Year Plans in India?

Ans: The NITI Aayog replaced the Planning Commission and introduced long-term vision documents and action agendas.

4th Schedule of Indian Constitution, Provisions, States, Articles

4th Schedule of Indian Constitution

The 4th Schedule of Indian Constitution discusses how seats in the Rajya Sabha are allocated among various states and Union Territories. Out of the total 250 seats, 238 are elected members representing States and Union Territory, while 12 are nominated by the President for their expertise in fields like literature, science, art, and social service. Originally, the Constitution had just eight schedules. The total went up to twelve over time through amendments.

4th Schedule of Indian Constitution

The 4th Schedule of Indian Constitution deals with the allocation of seats in the Rajya Sabha (Council of States). It specifies how many seats each State and Union Territory allocated in the Rajya Sabha. Elected members (238) are chosen through indirect elections by the elected members of State Legislative Assemblies. 12 members are nominated by the President for their contribution to arts, science, literature, and social service. The allocation of seats is not uniform,  it usually varies based on the population of each State and Union Territory. Though the Rajya Sabha has a maximum strength of 250, the current strength is 245:

  • 233 are elected members from States and UTs
  • 12 are nominated members by the President

Also Check:

Schedule of Indian Constitution

The Constitution of India was adopted on January 26, 1950 which consists of 8 Schedules initially which expanded to 12 Schedule of Indian Constitution through amendment.

4th Schedule of Indian Constitution History

In 1949, when the Indian Constitution was adopted, the idea was to have 217 seats in the Rajya Sabha from which 205 elected and 12 nominated. By the time the Constitution of India came into force in 1950, the seats were adjusted to 216 seats, 204 elected and 12 nominated. Over the years, the number of elective seats has increased in response to new states being formed, territories reorganized and population changes:

  • 1954: 204 elected seats
  • 1956: Increased to 207
  • 1970: Increased again to 220
  • Present: 238 elective seats allotted; currently, 233 are filled

4th Schedule of Indian Constitution Articles

The 4th Schedule of Indian Constitution is linked to Articles 4(1) and 80(2).

  • Article 4(1) explains that when Parliament passes a law under Article 2 or 3 (which deals with the formation or alteration of states), it must also include changes to the First and Fourth Schedules, wherever necessary.
  • Article 80(2) deals with the Rajya Sabha (Council of States) and says that the number of seats allocated to each State and Union Territory must follow the structure laid out in the Fourth Schedule.

4th Schedule of Indian Constitution Provisions

  • The Rajya Sabha (Council of States) can have a maximum of 250 members.
  • Out of these, 238 seats are allocated to States and Union Territories, while 12 members are nominated by the President for their expertise in fields like literature, science, art, and social service.
  • As of now, the total strength of Rajya Sabha is 245 with 233 elected members from States and Union Territories and 12 nominated members.
  • The elected members are chosen by the elected MLAs (Members of Legislative Assemblies) of each State and Union Territory.
  • The election process follows the system of proportional representation by means of a single transferable vote, ensuring fair representation for political parties based on their strength in the State Assemblies.

List of Seats Allocated to State and Union Territory

The 4th Schedule of Indian Constitution outlines how seats in the Rajya Sabha are distributed among the States and Union Territories. Uttar Pradesh has the highest representation with 31 seats in the Rajya Sabha. Some Union Territories like Andaman and Nicobar Islands and Chandigarh have no seats allotted. The table below includes the List of Seats Allocated to State and Union Territory:

List of Seats Allocated to State and Union Territory
State/Union Territory Number of Seats

Total

233

Uttar Pradesh

31

Maharashtra

19

Tamil Nadu

18

West Bengal

16

Bihar

16

Karnataka

12

Madhya Pradesh

11

Gujarat

11

Andhra Pradesh

11

Rajasthan

10

Odisha

10

Kerala

9

Telangana

7

Punjab

7

Assam

7

Jharkhand

6

Chhattisgarh

5

Haryana

5

Jammu and Kashmir

4

Himachal Pradesh

3

National Capital Territory of Delhi

3

Uttarakhand

3

Arunachal Pradesh

1

Goa

1

Manipur

1

Nagaland

1

Mizoram

1

Meghalaya

1

Puducherry

1

Sikkim

1

Tripura

1

Lakshadweep

0

Daman and Diu

0

Dadra and Nagar Haveli

0

Andaman and Nicobar Islands

0

Chandigarh

0

4th Schedule of Indian Constitution FAQs

Q1: What does the 4th Schedule of the Constitution deal with?

Ans: It allocates seats to each state and union territory in the Rajya Sabha (Council of States).

Q2: Under which Article is the 4th Schedule covered?

Ans: It is mentioned under Article 4 and Article 80 of the Indian Constitution.

Q3: How many total seats are there in the Rajya Sabha?

Ans: The Rajya Sabha has a maximum strength of 250 members, currently 245.

Q4: On what basis are seats allotted to states?

Ans: Seats are allocated based on the population of each state and union territory.

Q5: Do Union Territories have representation in the Rajya Sabha?

Ans: Yes, some Union Territories like Delhi and Puducherry have Rajya Sabha representation.

Monthly Current Affairs January 2026 for UPSC Prelims and Mains

Monthly Current Affairs January 2026

Monthly Current Affairs for January 2026 are a vital part of the UPSC Civil Services Examination (CSE) Syllabus. Current affairs include important events, decisions, and developments occurring in India and across the world. These issues span several areas such as politics, economy, society, culture, environment, science, technology, and sports. This article offers a detailed overview of Monthly Current Affairs January 2026, specifically prepared to support both Prelims and Mains examination preparation.

Monthly Current Affairs January 2026

Monthly Current Affairs January 2026 play a significant role in UPSC CSE 2026 preparation. To assist aspirants, Vajiram and Ravi publish the Monthly Current Affairs Magazine- The Recitals, along with Daily Prelims Pointers, Mains Articles, Editorial Analysis, and The Analyst- Newspaper Analysis Video. These resources systematically compile all major current affairs of the month from trusted sources such as PIB, Yojana, Kurukshetra, The Hindu, Indian Express, Economic Times, and Down to Earth. 

Monthly Current Affairs January 2026 for Prelims and Mains

The Monthly Current Affairs January 2026 include Daily Prelims Pointers, Mains Articles, and Editorial Analysis prepared by experienced faculty members and updated daily on the website. The topics are primarily sourced from The Hindu and The Indian Express to maintain relevance with the UPSC Syllabus. Prelims Pointers provide crisp and factual coverage suited for objective questions, while Mains Articles focus on developing analytical depth and answer writing skills. In addition, The Analyst- Newspaper Analysis Video offers detailed explanations of major news events along with a handout summarizing important points.

UPSC January Current Affairs 2026

On a daily basis, ten Prelims Pointers, four Mains Articles, and two Editorial Analysis are published to ensure comprehensive coverage of monthly current affairs. Along with this, aspirants can practice using the Daily MCQ Quiz and watch The Analyst- Newspaper Analysis Video for conceptual understanding. 

Below is the complete list of links for Daily Prelims Pointers, Mains Articles, Editorial Analysis, and The Analyst Videos for January 2026:

Monthly Current Affairs January 2026
January 2026 Date Prelims Pointers Link Mains Articles Link Editorial Analysis The Analyst- Newspaper Analysis Video

1 January 2026

Holiday

Holiday

Holiday

Holiday

2 January 2026

Click Here

Click Here

Click Here

Click Here

3 January 2026

Click Here

Click Here

Click Here

To be Updated

4 January 2026

To be Updated

To be Updated

To be Updated

To be Updated

5 January 2026

To be Updated

To be Updated

To be Updated

To be Updated

6 January 2026

To be Updated

To be Updated

To be Updated

To be Updated

7 January 2026

To be Updated

To be Updated

To be Updated

To be Updated

8 January 2026

To be Updated

To be Updated

To be Updated

To be Updated

9 January 2026

To be Updated

To be Updated

To be Updated

To be Updated

10 January 2026

To be Updated

To be Updated

To be Updated

To be Updated

11 January 2026

To be Updated

To be Updated

To be Updated

To be Updated

12 January 2026

To be Updated

To be Updated

To be Updated

To be Updated

13 January 2026

To be Updated

To be Updated

To be Updated

To be Updated

14 January 2026

To be Updated

To be Updated

To be Updated

To be Updated

15 January 2026

To be Updated

To be Updated

To be Updated

To be Updated

16 January 2026

To be Updated

To be Updated

To be Updated

To be Updated

17 January 2026

To be Updated

To be Updated

To be Updated

To be Updated

18 January 2026

To be Updated

To be Updated

To be Updated

To be Updated

19 January 2026

To be Updated

To be Updated

To be Updated

To be Updated

20 January 2026

To be Updated

To be Updated

To be Updated

To be Updated

21 January 2026

To be Updated

To be Updated

To be Updated

To be Updated

22 January 2026

To be Updated

To be Updated

To be Updated

To be Updated

23 January 2026

To be Updated

To be Updated

To be Updated

To be Updated

24 January 2026

To be Updated

To be Updated

To be Updated

To be Updated

25 January 2026

To be Updated

To be Updated

To be Updated

To be Updated

26 January 2026

To be Updated

To be Updated

To be Updated

To be Updated

27 January 2026

To be Updated

To be Updated

To be Updated

To be Updated

28 January 2026

To be Updated

To be Updated

To be Updated

To be Updated

29 January 2026

To be Updated

To be Updated

To be Updated

To be Updated

30 January 2026

To be Updated

To be Updated

To be Updated

To be Updated

31 January 2026

To be Updated

To be Updated

To be Updated

To be Updated

Importance of Monthly Current Affairs January 2026 for UPSC Aspirants

Monthly Current Affairs remain the backbone of UPSC 2026 preparation, reflecting contemporary developments of national and international importance. Covering subjects like polity, economy, environment, society, and science, the Monthly Current Affairs January 2026 help aspirants strengthen awareness, analytical ability, and conceptual understanding, which are essential for clearing both Pre and Mains stages of the examination.

Assessing Awareness and Analytical Ability

Monthly Current Affairs January 2026 go beyond factual learning and emphasize understanding the broader impact of events. They assess an aspirant’s awareness of current national and global issues along with the ability to analyze causes, consequences, and policy responses. This approach helps develop critical thinking skills and a well rounded perspective required for civil services.

Integrating Static and Dynamic Syllabus Components

January 2026 Current Affairs help connect static subjects with ongoing developments. Policy decisions, economic reforms, international relations, and social changes can be linked with topics from polity, economy, geography, and history. This integration enhances answer quality by allowing aspirants to support theoretical concepts with real life examples.

Dynamic and Evolving Nature of Preparation

The importance of Monthly Current Affairs January 2026 also lies in their constantly changing nature. Since current events evolve daily, aspirants must stay updated regularly. This dynamic aspect of preparation encourages continuous learning, adaptability, and alertness, which are necessary to handle the unpredictable nature of UPSC 2026 Questions.

Relevance to Civil Services and Governance

Monthly Current Affairs January 2026 are directly linked to real world governance and administration. They introduce aspirants to current policy challenges, administrative decisions, and socio-economic issues faced by the country. Such topics are frequently discussed during the UPSC interview stage, where candidates are evaluated on awareness, clarity of thought, and balanced opinions.

Monthly Current Affairs January 2026 FAQs

Q1: How should aspirants prepare Monthly Current Affairs for UPSC CSE?

Ans: By regularly reading newspapers, following standard monthly compilations, and revising key topics with answer writing practice.

Q2: Why are Monthly Current Affairs important for UPSC preparation?

Ans: They link static syllabus topics with present day issues and play a crucial role in Prelims, Mains, and Interview stages.

Q3: What are Vajiram and Ravi Prelims Pointers?

Ans: They are short, exam oriented current affairs notes prepared daily for effective UPSC Prelims revision.

Q4: Which newspapers are best for UPSC Current Affairs?

Ans: The Hindu and The Indian Express are the most reliable newspapers for UPSC oriented current affairs coverage.

Q5: How should newspaper notes be prepared for UPSC CSE?

Ans: By identifying exam relevant issues, summarizing them concisely, and organizing them according to the GS syllabus for quick revision.

Vice Presidents of India from 1952 to 2026, List, Powers, Tenure

Vice Presidents of India

The Vice President of India hold the second-highest constitutional office after the President. As per Article 65 of the Indian Constitution, the Vice President is in charge during situations where the President is unable to fulfill their duties whether due to resignation, removal, death, impeachment, or incapacity. By default, the Vice Presidents of India also serves as the ex-officio Chairman of the Rajya Sabha, presiding over its sessions and ensuring the smooth conduct of proceedings. Since the role was established, 15 strong personalities have been Vice Presidents of India.

Vice Presidents of India

Unlike the President, the Vice Presidents of India are elected only by the members of both houses of Parliament, Lok Sabha and Rajya Sabha. State legislatures have no role in this election. C. P. Radhakrishnan serving as the 15th Vice President of India since September 9, 2025. The first to hold the position was Dr. Sarvepalli Radhakrishnan, who served from May 13, 1952, to May 12, 1957. 

Mohammad Hamid Ansari remains the only Vice President to complete two full terms, serving from August 11, 2007, to August 11, 2017. He was succeeded by M. Venkaiah Naidu, who held the post under President Ram Nath Kovind until August 2022. The Vice Presidents of India serve a five-year term but continue in office until a successor is elected.

Current Vice President of India

C. P. Radhakrishnan has been elected as the 15th and Current Vice President of India. He secured a total of 452 votes, comfortably crossing the required majority mark of 391 votes, and won the contest by a margin of 152 votes.

The Vice President of India holds the second-highest constitutional office in the country. By virtue of this position, the Vice-President also serves as the ex-officio Chairman of the Rajya Sabha. The election to this office is conducted by an electoral college consisting of members from both Houses of Parliament. Unlike the presidential election, the State Legislatures have no role in this process.

List of Vice Presidents of India from 1952 to 2026

Dr. Sarvepalli Radhakrishnan was First Vice President of India, took oath at Rashtrapati Bhavan on May 13, 1952. Below is the complete List of Vice Presidents of India from 1952 to 2026:

List of Vice Presidents of India from 1952 to 2026
S. No. Vice-President Tenure (From) Tenure (To) President(s) During Tenure
1 Dr. Sarvepalli Radhakrishnan 13 May 1952 12 May 1962 Dr. Rajendra Prasad
2 Dr. Zakir Hussain 13 May 1962 12 May 1967 Dr. Sarvepalli Radhakrishnan
3 Varahagiri Venkata Giri 13 May 1967 20 July 1969 Dr. Zakir Hussain
4 Gopal Swarup Pathak 31 August 1969 30 August 1974 V. V. Giri, Dr. Fakhruddin Ali Ahmed
5 Basappa Danappa Jatti 31 August 1974 30 August 1979 Dr. Fakhruddin Ali Ahmed, Neelam Sanjiva Reddy
6 Justice Muhammad Hidayatullah 31 August 1979 30 August 1984 Neelam Sanjiva Reddy, Giani Zail Singh
7 Ramaswamy Venkataraman 31 August 1984 24 July 1987 Giani Zail Singh
8 Shankar Dayal Sharma 7 September 1987 24 July 1992 Ramaswamy Venkataraman
9 Kocheril Raman Narayanan 21 August 1992 24 July 1997 Shankar Dayal Sharma
10 Krishan Kant 21 August 1997 27 July 2002 K. R. Narayanan, A. P. J. Abdul Kalam
11 Bhairon Singh Shekhawat 19 August 2002 21 July 2007 A. P. J. Abdul Kalam
12 Mohammad Hamid Ansari 11 August 2007 10 August 2017 Pratibha Patil, Pranab Mukherjee, Ram Nath Kovind
13 M. Venkaiah Naidu 11 August 2017 11 August 2022 Ram Nath Kovind
14 Jagdeep Dhankhar 11 August 2022 21 July 2025 Droupadi Murmu
15 C. P. Radhakrishnan 09 September 2025 Incumbent Droupadi Murmu

Vice Presidents of India Constitutional Provision

The Vice Presidents of India holds an important constitutional position, acting as the second-highest authority in the country and playing a key legislative and executive role. The provisions related to the office of the Vice Presidents of India are discussed in Articles 63 to 70 of the Indian Constitution. These articles outline the eligibility, method of election, tenure, powers, functions, and procedures in case of vacancies. The table below includes overview of Vice President of India Constitutional Provision:

Vice President of India Constitutional Provision
Article Details

Article 63

There will be an Indian Vice President

Article 64

The Vice-President shall not hold any other paid post and shall serve as the Council of States’ de facto Chairman

Article 65

When there are brief gaps in the office or when the president is not present, the vice president fills in for him or herself.

Article 66

The members of an electoral college made up of representatives from both Houses of Parliament will choose the vice president. The Vice-President is not permitted to serve in either the House of Representatives or the House of the Legislature of any State.

Article 67

From the time of his appointment, the Vice-tenure President’s in office must be for a period of five years.

Article 68

Before the term’s expiration, a vote must be held to fill any vacancies caused by the vice president’s tenure coming to an end. Elections must be held as soon as possible to fill any vacancies left by the vice president’s death, resignation, or removal.

Article 69

Each Vice President must take an oath or affirmation before the President, or a person he has nominated in that capacity.

Article 70

President’s duties are discharged in other emergencies

First Vice President of India

Dr. Sarvepalli Radhakrishnan was First Vice President of India. He was born on September 5, 1888, to Shri S. Veerasamiah. A renowned scholar and philosopher, Radhakrishnan held several academic honours, including an M.A., and multiple honorary degrees such as D.Litt., LL.D., D.C.L., and D.L. He was also a Fellow of the British Academy (F.B.A.) and the Royal Society of Literature (F.R.S.L.), and an Honorary Fellow at All Souls College, Oxford.

Vice Presidents of India Eligibility Criteria

To be eligible for the position of Vice President of India, a candidate must meet certain constitutional criteria. These qualifications ensure that the office is held by an individual with sufficient experience, integrity, and independence. Below are the key Vice Presidents of India Eligibility Criteria.

If elected while still a member of either House, he is considered to have vacated that seat from the day he takes office. Also, the Vice Presidents of India cannot hold any salaried position under the central, state, or local governments, or any public authority during the term.

  1. Must be a citizen of India.
  2. Must be at least 35 years old.
  3. Must not hold any office of profit under the central or state government, or any public or local authority.

Vice Presidents of India Tenure

The Vice Presidents of India assumes office on the date he begins his term, which lasts for five years. However, he can choose to resign before completing the term. Apart from resignation, there are several other situations where the office of the Vice President can become vacant:

  1. Completion of the five-year term
  2. Voluntary resignation
  3. Removal through a formal process
  4. Death while in office
  5. If the election is declared invalid by the Supreme Court

Vice Presidents of India Impeachment

Article 67(b) of the Indian Constitution deals with the removal of the Vice-President of India. It states that the Vice-President may be removed from office by a resolution of the Rajya Sabha (Council of States) passed by a majority of all its then members and agreed to by the Lok Sabha (House of the People). However, such a resolution cannot be moved unless at least 14 days’ notice has been given of the intention to move it.

Vice Presidents of India Powers and Functions

  • Chairman of Rajya Sabha: The Vice Presidents of India serves as the ex-officio Chairman of the Rajya Sabha. In this role, his powers and functions are similar to those of the Speaker of the Lok Sabha.
  • Acts as President: He is  an Acting President if the President resigns, is removed, dies, or otherwise becomes unable to serve. However, he can hold the office for a maximum of six months until a new President is elected.
  • Temporary Duties: The Vice President also performs the duties of the President during temporary absences due to illness, travel, or any other reason.
  • Similarity to U.S. System: His role resembles that of the Vice President of the United States, who presides over the Senate (the upper house of Congress).
  • Legal Continuity: If the Supreme Court later declares an election of Vice Presidents of India void, all decisions and actions made before that judgment remain valid and are not reversed.

Vice Presidents of India Important Facts

  • The Vice Presidents of India is the ex-officio Chairman of the Rajya Sabha and presides over its sessions.
  • The Vice President’s office may fall vacant due to:
    • Resignation
    • Removal
    • Death
    • Absence caused by illness or incapacity
  • When the Vice President discharges the functions of the President, the Deputy Chairman of the Rajya Sabha takes over the Vice President’s duties in the House.
  • Articles 63 to 71 of the Constitution discusses the Vice Presidents of India.
  • The 11th Constitutional Amendment changed the method of election. Earlier, both Houses met in a joint sitting to elect the Vice President. Now, they vote separately.
  • Parliament determines the salary of the Vice Presidents of India. The current monthly salary of the Rajya Sabha Chairman (ex-officio the Vice President of India) is ₹4 lakh.
Also Check Related Post
Vice Presidents of India Education Ministers of India
Foreign Ministers of India Finance Ministers of India
Cabinet Ministers of India Prime Ministers of India
Deputy Prime Minister of India Presidents of India
Ministry of External Affairs

Vice President of India FAQs

Q1: How many vice presidents are there in India?

Ans: India has had 15 Vice Presidents since independence, each serving as the second-highest constitutional office after the President.

Q2: Who is the 17th vice president of India?

Ans: CP Radhakrishnan is the 17th Vice President of India, elected in September 2025.

Q3: Who is the vice president of India now?

Ans: CP Radhakrishnan is the Vice President of India.

Q4: What are the powers of the Vice President of India?

Ans: The Vice President is Rajya Sabha Chairman, presides over its sessions, maintains order, decides rules, and acts as President in case of vacancy, resignation, or absence.

Q5: Who was the first woman vice president of India?

Ans: India has never had a woman Vice President.

IUCN Red List, Criteria, Category, Endangered Species, Criticism

IUCN Red List

Plants and animals around the world are facing serious threats due to habitat loss, climate change, pollution, and human activities. To understand which species are at risk of extinction, a reliable global system is required. The IUCN Red List provides this system by scientifically assessing species and classifying them based on their risk of extinction. It helps governments, scientists, and conservation agencies plan effective protection measures.

IUCN Red List

The IUCN Red List of Threatened Species was started in 1964 by the International Union for Conservation of Nature (IUCN). It is the world’s most trusted source for information on the conservation status of plants, animals, and fungi. The IUCN headquarters is located in Gland, Switzerland. As of recent assessments, more than 160,000 species have been evaluated globally, making it a key tool to measure the health of global biodiversity.

IUCN Red List Criteria

These criteria evaluate extinction risk using measurable biological indicators, ensuring global comparability, scientific credibility, and transparency across taxa and regions.

  • Population Reduction: Species are assessed based on population decline rates, such as over 90% reduction within ten years for Critically Endangered classification.
  • Geographic Range: Small or shrinking distribution areas, combined with fragmentation or habitat decline, increase extinction risk classification under Red List thresholds.
  • Population Size: Species with fewer than 50 mature individuals face extreme extinction risk, while fewer than 2,500 individuals indicate Endangered status.
  • Population Trend Analysis: Ongoing decline in mature individuals, even with larger populations, elevates extinction risk due to long term instability.
  • Quantitative Extinction Modelling: Statistical models estimate probability of extinction, such as a 50% likelihood within ten years qualifying for Critically Endangered status.
  • Threat Assessment: Anticipated future threats like climate change, invasive species, or exploitation are included when scientifically justified.

IUCN Red List Categories

These categories classify species into nine clearly defined conservation status groups based on extinction risk severity.

  1. Extinct (EX): No individuals remain alive after exhaustive surveys across known and expected habitats.
  2. Extinct in the Wild (EW): Species survive only in captivity, cultivation, or outside their natural historical range.
  3. Critically Endangered (CR): Species face extremely high extinction risk due to severe population loss, minimal numbers, or rapid habitat collapse.
  4. Endangered (EN): Species face very high extinction risk with significant decline, restricted range, or continuing population decrease.
  5. Vulnerable (VU): Species face high extinction risk if current threats persist without conservation intervention.
  6. Near Threatened (NT): Species close to qualifying for threatened categories due to emerging population or habitat pressures.
  7. Least Concern (LC): Species remain widespread and abundant with stable populations and low extinction risk.
  8. Data Deficient (DD): Insufficient information exists to assess extinction risk accurately.
  9. Not Evaluated (NE): Species have not yet undergone Red List assessment.

IUCN Red List Endangered Species in India

India hosts significant biodiversity, with numerous endemic species assessed under the IUCN Red List across multiple threat categories.

  • Pygmy Hog (Critically Endangered): The world’s smallest wild pig, restricted to Assam’s tall grasslands, with survival linked to intact grassland ecosystems.
  • Himalayan Brown Bear (Critically Endangered): Found in high altitude regions of north India, threatened by habitat loss and human conflict.
  • Namdapha Flying Squirrel (Critically Endangered): Endemic to Arunachal Pradesh’s Namdapha Tiger Reserve, threatened by hunting and restricted range.
  • Kondana Rat (Critically Endangered): Restricted to a one square kilometre plateau near Pune, vulnerable to tourism and grazing pressures.
  • Malabar Civet (Critically Endangered): Endemic to the Western Ghats, severely affected by deforestation and plantation expansion.
  • Tiger (Endangered): Global population increased to 3,890 in 2015, with India hosting the largest share despite global decline elsewhere.
  • Asiatic Lion (Endangered): Restricted to Gir forests, Gujarat, facing disease and habitat concentration risks.
  • Red Panda (Endangered): Himalayan endemic threatened by habitat fragmentation and poaching.
  • Hangul or Kashmir Stag (Endangered): Confined to limited Himalayan habitats, impacted by grazing and habitat degradation.
  • Lion tailed Macaque (Endangered): Western Ghats endemic, sensitive to habitat fragmentation from plantations and infrastructure.

IUCN Red List Criticism

Despite global acceptance, the IUCN Red List has faced methodological and interpretational criticisms over time.

  • Data Transparency Concerns: Early criticisms highlighted limited documentation of data sources, prompting later improvements in peer review and disclosure.
  • Inconsistent Classification: Scientific studies noted variation in assessment quality across taxa due to uneven data availability.
  • Geospatial Data Gaps: Lack of consistent satellite and spatial mapping reduced accuracy for range restricted species assessments.
  • Policy Misuse Risks: Governments may misuse Red List data to justify resource exploitation or policy decisions without ecological context.
  • Assessment Lag: Rapid environmental change can outpace reassessment cycles, delaying category updates for declining species.

IUCN Red List Recent Developments

Recent updates reflect expanding coverage, new analytical tools, and alarming global biodiversity trends.

  • Rising Threat Numbers: By March 2025, over 47,000 species were classified as threatened, reflecting accelerating human driven biodiversity loss.
  • Freshwater Fish Decline: Around 25% of assessed freshwater fish species face extinction due to pollution, dams, overfishing, and climate change.
  • Tree Species Crisis: Over 16,425 tree species are threatened globally, exceeding combined threatened birds, mammals, reptiles, and amphibians.
  • Marine Ecosystem Stress: Pillar Coral shifted to Critically Endangered after over 80% population decline since 1990 due to bleaching and pollution.
  • Bird Population Decline: More than half of global bird species show declining trends due to agricultural expansion and habitat degradation.
  • Positive Recovery Signals: Green Sea Turtle improved from Endangered to Least Concern following decades of targeted conservation efforts.
  • Green Status of Species: Introduced as a complementary framework, assessing species recovery success beyond extinction risk alone.

IUCN Red List FAQs

Q1: What is the IUCN Red List?

Ans: The IUCN Red List is a global scientific inventory assessing extinction risk of species using standardized and peer reviewed criteria.

Q2: How many species are threatened globally according to the IUCN Red List?

Ans: As of 2025, more than 47,000 species worldwide are classified as threatened with extinction.

Q3: Which categories are considered “threatened” under the IUCN Red List?

Ans: Critically Endangered, Endangered, and Vulnerable collectively form the “threatened” group under the IUCN Red List.

Q4: Who conducts IUCN Red List assessments?

Ans: Assessments are conducted by IUCN Species Survival Commission experts, BirdLife International, ZSL, and other specialist groups.

Q5: Why is the IUCN Red List important for conservation?

Ans: It guides policy decisions, conservation funding, habitat protection, and global biodiversity monitoring using scientific evidence.

3rd Schedule of Indian Constitution, Provisions, States, Articles

3rd Schedule of Indian Constitution

The 3rd Schedule of Indian Constitution includes the official oaths or affirmations taken by individuals assuming key constitutional positions in India. It’s linked to the following Articles: 75(4), 99, 124(6), 148(2), 164(3), 188, and 219. It applies to posts including Union and State Ministers, Members of Parliament and State Legislatures, Judges of the Supreme Court and High Courts and The Comptroller and Auditor-General of India (CAG).

Each oath contains specific phrases like “faithfully discharge the duties,” “bear true faith and allegiance to the Constitution,” and “uphold the sovereignty and integrity of India.”

Schedule of Indian Constitution

The Constitution of India was adopted on January 26, 1950 which consists of 8 Schedules initially which expanded to 12 Schedule of Indian Constitution through amendment.

Also Check:

3rd Schedule of Indian Constitution Provisions

The 3rd Schedule of Indian Constitution prescribes the Forms of Oaths or Affirmations for various constitutional authorities. These forms are legally binding and ensure allegiance to the Constitution and the sovereignty of India. Here’s the list of constitutional posts along with their corresponding Articles:

  • Union Ministers of India - Article 75(4)
  • Parliament Election Candidates
  • Members of Parliament (MPs) - Article 99
  • Supreme Court Judges - Article 124(6)
  • Comptroller and Auditor General - Article 148(2)
  • State Ministers - Article 164(3)
  • State Legislature Election’s Candidates
  • State Legislature Members - Article 188
  • High Court Judges - Article 219

Keywords Associated With Different Posts

The oaths or affirmations under the 3rd Schedule of Indian Constitution differ slightly based on the nature of the post which are discussed in the table below:

Keywords Associated With Different Posts
Post Key Phrases in the Oath

Union Ministers of India

Uphold the sovereignty and integrity of India; Oath of secrecy

Parliament Election Candidates

Uphold the sovereignty and integrity of India

Members of Parliament (MPs)

Uphold the sovereignty and integrity of India

Supreme Court Judges

Uphold the Constitution and the laws

Comptroller and Auditor General (CAG)

Uphold the Constitution and the laws

State Ministers

Uphold the sovereignty and integrity of India; Oath of secrecy

State Legislature Election Candidates

Uphold the sovereignty and integrity of India

State Legislature Members

Uphold the sovereignty and integrity of India

High Court Judges

Uphold the Constitution and the laws

3rd Schedule of Indian Constitution FAQs

Q1: What does the 3rd Schedule of the Constitution deal with?

Ans: It prescribes the Forms of Oaths or Affirmations for various constitutional posts in India.

Q2: Who takes oaths under the 3rd Schedule?

Ans: The President, Ministers, MPs, Judges, CAG, and State-level constitutional authorities take oaths under this Schedule.

Q3: How many oath forms are included in the 3rd Schedule?

Ans: There are 8 different oath forms mentioned for various constitutional functionaries.

Q4: Is the oath mandatory before assuming office?

Ans: Yes, taking the prescribed oath is a legal requirement before holding office.

Q5: What is the purpose of the oath in the 3rd Schedule?

Ans: To affirm allegiance to the Constitution and the duty to discharge responsibilities faithfully.

2nd Schedule of Indian Constitution, Provisions, States, Articles

2nd Schedule of Indian Constitution

The 2nd Schedule of Indian Constitution deals with the salaries, allowances, and privileges of key constitutional authorities. This includes the President, Governors of States, Speakers and Deputy Speakers of the Lok Sabha and State Legislative Assemblies, Chairpersons and Deputy Chairpersons of the Rajya Sabha and State Legislative Councils, Judges of the Supreme Court and High Courts, and the Comptroller and Auditor General of India (CAG). 

Schedule of Indian Constitution

The Constitution of India was adopted on January 26, 1950 which consists of 8 Schedules initially which expanded to 12 Schedule of Indian Constitution through amendment.

Also Check:

2nd Schedule of Indian Constitution Provisions

2nd Schedule of Indian Constitution is divided into various parts which includes provisions related to salaries, allowances and other benefits discussed below:

  • Part A: Part A: Deals with the President and Governors of States
  • Relevant Articles: 59(3), 65(3), 158(3)
  • Covers their salaries and allowances.
  • Part B: Omitted by the 7th Constitutional Amendment Act, 1956
  • Earlier related to Ministers for the Union and States.
  • Part C: Covers the Speaker and Deputy Speaker of the Lok Sabha, Chairman and Deputy Chairman of the Rajya Sabha, and similar posts in State Legislatures
  • Relevant Articles: 97, 186
  • Focuses on their salaries and entitlements.
  • Part D: Provisions related to Judges of the Supreme Court and High Courts
  • Relevant Articles: 125, 221
  • Part E: Deals with the Comptroller and Auditor-General of India (CAG)
  • Relevant Article: 148(3)

2nd Schedule of Indian Constitution FAQs

Q1: What does the 2nd Schedule of the Indian Constitution deal with?

Ans: It deals with the salaries, allowances, and privileges of constitutional authorities in India.

Q2: Which Articles are associated with the 2nd Schedule?

Ans: Articles 59, 65, 75, 97, 125, 148, 158, and 221 refer to the 2nd Schedule.

Q3: Who are covered under the 2nd Schedule?

Ans: The President, Governors, Judges, Comptroller and Auditor General, Speaker, Deputy Speaker, and others.

Q4: Does it apply to both Central and State officials?

Ans: Yes, it applies to top constitutional posts at both central and state levels.

Q5: How many parts are there in the 2nd Schedule?

Ans: It contains eight parts (Parts A to H), each dealing with different authorities.

Mount Bur Ni Telong

Mount Bur Ni Telong

Mount Bur Ni Telong Latest News

Indonesian authorities recently raised the alert for Mount Bur Ni Telong volcano due to increased activity, including numerous earthquakes

About Mount Bur Ni Telong

  • It is an active stratovolcano.
  • It is located in Indonesia’s westernmost province of Aceh.
  • It is one of the best climbing spots in Aceh.
  • The volcano stands at approximately 2,624 meters above sea level. 
  • The conical Bur ni Telong volcano was constructed at the southern base of the massive Bur ni Geureudong volcanic complex, one of the largest in northern Sumatra.
  • It is formed by multiple layers of lava and eruptive materials, making it prone to explosive eruptions and highly hazardous.

What is a Stratovolcano?

  • It is a tall, steep, and cone-shaped type of volcano.
  • Unlike flat shield volcanoes, they have higher peaks.
  • They are typically found above subduction zones, and they are often part of large volcanically active regions, such as the Ring of Fire that frames much of the Pacific Ocean.
  • Strato Volcanoes comprise the largest percentage (~60%) of the Earth’s individual volcanoes, and most are characterized by eruptions of andesite and dacite, lavas that are cooler and more viscous than basalt.
  • These more viscous lavas allow gas pressures to build up to high levels. Therefore, these volcanoes often suffer explosive eruptions. 
  • They are usually about half-half lava and pyroclastic material, and the layering of these products gives them their other common name of composite volcanoes.
  • At the peak, stratovolcanoes usually have a small crater. The crater may be filled with water or ice, or it may contain a volcanic dome during a period of relative inactivity.

Source: DEV

Mount Bur Ni Telong FAQs

Q1: What type of volcano is Mount Bur Ni Telong?

Ans: It is an active stratovolcano.

Q2: In which country is Mount Bur Ni Telong located?

Ans: It is located in Indonesia’s Aceh province.

Q3: What is the approximate elevation of Mount Bur Ni Telong above sea level?

Ans: About 2,624 meters.

86th Constitutional Amendment Act, Objectives, Key Details

86th Constitutional Amendment Act

The 86th Constitutional Amendment Act protects the citizen’s right to education. It covers all about the challenges related to education in India. The amendment adds three provisions in the constitution of India that target the rights to free and compulsory education for children in the age group between 6 to 14 years as a fundamental right.

86th Constitutional Amendment Act, 2002

The 86th Constitutional Amendment Act, 2002 is also known as the Right of Children to Free and Compulsory Education (RTE). The amendment added provisions about the necessity of a child to receive free and compulsory education as a fundamental right. 

Under Article 21A of the Indian Constitution, every child aged between 6 to 14 years has the fundamental right to receive free and compulsory elementary education of an equitable and satisfactory quality. It places the responsibility on State Governments to ensure this right is fulfilled.

A significant implicant of this amendment is that all schools catering to this age group are mandated to provide free and compulsory education. Moreover, no private unaided school is permitted to deny admission to eligible children, and failure to comply may invite penalties and legal action.

Additionally, the amendment emphasizes the role of local authorities in implementing this provision. They are required to develop and enforce suitable schemes involving parents, teachers, and school management committees to ensure the effective realization of this constitutional right.

86th Amendment Act 2002 Objectives

86th Amendment Act 2002 has the following objectives: 

  • The amendment makes sure that every child below 14 years of age is getting free and compulsory education in the form of formal schooling. 
  • Article 21A provides guarantee of right to education, making education a fundamental right for children aged 6 to 14 years. 
  • It is mandatory for the state to provide free and compulsory education to children in the form of proper schooling. 
  • Schools should be established in the vicinity of residential areas, making enrollment easy. 
  • The 86th Amendment Act, 2002 also lays down the responsibility on the parents to send their children to school.
    The Act further ensures that children are not only enrolled but also provided an environment conducive to learning, including early childhood care and opportunities for quality education.

Right to Education

The Right to Education Act, introduced in 1995, is a landmark legislation aimed at securing free and compulsory education for all children aged 6 to 14 years, regardless of their religion, caste, culture, or background.

  1. The Act makes sure that every child who wants to receive an education and complete primary schooling is entitled to do so.
  2.  Many children are deprived of education due to financial constraints, lack of infrastructure, and limited access to resources. This Act seeks to eliminate those barriers.
  3. It recognizes that families may struggle to afford education or may be unaware of their children's rights. The Act empowers them by offering legal backing and institutional support.
  4. By making education a fundamental right, the Act provides families and communities with a platform to demand schooling for their children.
  5. The overall aim is to create an environment where no child is left behind, and where quality education is not a privilege but a guaranteed right.

86th Constitutional Amendment Act FAQs

Q1: What is the 86th Constitutional Amendment Act?

Ans: The 86th Constitutional Amendment Act, 2002 made education a fundamental right for children aged 6 to 14 years by inserting Article 21A.

Q2: Which fundamental duty was added by the 86th amendment Act 2002?

Ans: The duty of parents or guardians to provide opportunities for education to children aged 6 to 14 was added as Article 51A.

Q3: What is the 86th Constitution amendment Bill significance?

Ans: It made free and compulsory education for children aged 6–14 a justiciable fundamental right under Article 21A.

Q4: Is Right to Education a fundamental right?

Ans: Yes, the Right to Education is a fundamental right under Article 21A of the Constitution.

Q5: Which article of Indian Constitution ensures right to education?

Ans: Article 21A of the Indian Constitution ensures the Right to Education.

Vishnugad Pipalkoti Hydro Electric Project (VPHEP)

Vishnugad Pipalkoti Hydro Electric Project

Vishnugad Pipalkoti Hydro Electric Project (VPHEP) Latest News

Around 60 people were injured after a loco train carrying workers and officials hit a goods train inside the Pipalkoti tunnel of the Vishnugad–Pipalkoti Hydroelectric Project recently.

About Vishnugad Pipalkoti Hydro Electric Project (VPHEP)

  • It is a run-of-river hydropower scheme being developed on the Alaknanda River (a major tributary of the Ganga River) in the Chamoli district of Uttarakhand.
  • With an installed capacity of 444 MW (4 × 111 MW) and a gross head of approximately 237 metres, VPHEP is designed to provide peaking power to India’s Northern Grid.
  • The project, when completed, will generate an estimated 1,665 gigawatt-hours (or million kilowatt-hours) of electricity in a typical year. 
  • The project includes a 65-meter diversion dam, a 13.4-km headrace tunnel, a 3-km tailrace tunnel, and an underground powerhouse. 
  • All water diverted from the river will be returned to the river approximately 18 km after the point of diversion. 
  • It is being developed by THDC India Ltd (formerly Tehri Hydro Development Corporation Limited) and financed by a US$ 648 million loan from the World Bank.
    • THDC is a joint venture between the government of India and the government of Uttar Pradesh.

Source: TOI

Vishnugad Pipalkoti Hydro Electric Project (VPHEP) FAQs

Q1: On which river is the Vishnugad Pipalkoti Hydro Electric Project being developed?

Ans: On the Alaknanda River, a major tributary of the Ganga.

Q2: What type of hydropower project is the Vishnugad Pipalkoti Hydro Electric Project?

Ans: A run-of-river hydropower scheme.

Q3: What is the total installed capacity of the Vishnugad Pipalkoti Hydro Electric Project?

Ans: 444 MW (4 × 111 MW).

Q4: Which agency is developing the Vishnugad Pipalkoti Hydro Electric Project?

Ans: It is being developed by THDC India Ltd (formerly Tehri Hydro Development Corporation Limited).

Land Stack

Land Stack

Land Stack Latest News

Recently, the Minister of State for Rural Development and Communications launched the ‘Land Stack’ in the Pilot Locations of Chandigarh and Tamil Nadu and released the ‘Glossary of Revenue Terms’ (GoRT).

About Land Stack

  • It is an integrated, GIS-based digital platform designed to consolidate all land records into a singular, accessible platform.
  • It is inspired by successful models in nations such as Singapore, the UK, and Finland. 
  • It was launched under the Digital India Land Record Modernisation Programme (DILRMP).

Benefits of Land Stack

  • The Land Stack portal enables informed decision-making by citizens through integrated access to land-related information.
  • It enhances citizen convenience, transparency and trust.
  • It reduces the risk of inadvertent purchase of unauthorised or non-compliant properties.
  • It improves inter-departmental coordination and supports data-driven governance.
  • It represents a significant e-Governance reform in land administration.

What is the Glossary of Revenue Terms?

  • It provides meanings of various land-related revenue terms in Vernacular, Hindi, English, and Roman scripts.
  • The objective is to harmonize terminology to make land data comparable and interoperable nationally, without replacing State-specific terminology.
  • It serves as an authoritative reference for revenue officials, policymakers, judicial authorities, and citizens.

Source: PIB

Land Stack FAQs

Q1: What is Land Stack?

Ans: A digital platform for land records management

Q2: Which government initiative is Land Stack a part of?

Ans: Digital India

District Mineral Foundations

District Mineral Foundations

District Mineral Foundations Latest News

The Allahabad High Court recently held that the formation of District Mineral Foundations is  beneficial legislation and must be construed liberally for those who are affected negatively by mining operations.

About District Mineral Foundations 

  • DMFs are statutory bodies in India established by the state governments by notification. 
  • They derive their legal status from Section 9B of the Mines and Minerals (Development and Regulation) Act, 1957, as amended on 26 March 2015 as the Mines and Minerals (Development and Regulation) Amendment Act, 2015.
  • In any district affected by mining-related operations, the State Government shall, by notification, establish a trust, as a non-profit body, to be called the DMF.
  • Purpose: To work in the interest and benefit of persons and areas affected by mining-related operations in a manner as may be prescribed by the respective State Government.
  • Jurisdiction:
    • The operation of DMFs falls under the jurisdiction of the relevant State Government. 
    • Composition and functions of the DMF are prescribed by the State Governments.
  • Funding: It is funded through the contributions from the holders of major or minor mineral concessions in the district, as may be prescribed by the Central or State Government.
  • The Central Government has notified the rates of contribution payable by miners to the DMFs.
    • In the case of all mining leases executed before 12th January, 2015, miners will have to contribute an amount equal to 30% of the royalty payable by them to the DMFs. 
    • If mining leases are granted after 12.01.2015, the rate of contribution would be 10% of the royalty payable.
  • The Fund available with the Trust shall be used for:
    • The overall development of the area affected by mining-related operations in the District in accordance with the Annual Action Plan prepared by the Trustees of the Foundation for the purpose.
    • Creation of local infrastructure for socio-economic purposes.
    • Providing, maintaining, or upgrading community assets and services for the local population in the area affected by mining-related operations.
    • Organising or conducting training programmes to skill development and capacity building for creating employment and self-employment capabilities.

Pradhan Mantri Khanij Kshetra Kalyan Yojana (PMKKKY)

  • The Ministry of Mines launched PMKKKY in 2015 for the welfare of areas and people affected by mining-related operations, using the funds generated by DMFs.
  • Objectives:
    • To implement various developmental and welfare projects in mining-affected areas, complementing the existing ongoing schemes of the State and Central Government.
    • To minimize/mitigate the adverse impacts, during and after mining, on the environment, health, and socio-economics of people in mining districts.
    • To ensure long-term sustainable livelihoods for the affected people in mining areas.
  • Utilisation of Funds:
    • At least 60% of PMKKKY funds to be utilized for high-priority areas such as Drinking water supply, Health care, Education, Environment preservation, etc.
    • Up to 40% of the PMKKKY to be utilized for other priority areas such as Physical infrastructure, Irrigation, Energy, and Watershed Development, etc.

Source: LL

District Mineral Foundations FAQs

Q1: Who establishes the District Mineral Foundations in mining-affected districts?

Ans: The State Government, by notification.

Q2: What type of body is a District Mineral Foundation?

Ans: A statutory, non-profit trust.

Q3: What is the primary purpose of a District Mineral Foundation?

Ans: To work for the interest and benefit of persons and areas affected by mining-related operations.

Q4: How are District Mineral Foundations funded?

Ans: Through contributions from holders of major or minor mineral concessions in the district.

Voice over WiFi

Voice over WiFi

Voice over WiFi Latest News

 Recently, the Bharat Sanchar Nigam Limited (BSNL) announced the nationwide rollout of Voice over WiFi (VoWiFi).

About Voice over WiFi

  • It is a technology that allows voice calls over Wi-Fi networks, bypassing traditional cellular networks.
  • It enables customers to make and receive voice calls and messages over a Wi-Fi network.
  • VoWiFi is an IP Multimedia Subsystem (IMS)-based service using the customer’s existing mobile number and phone dialer, without the need for third-party applications.
  • It is also known as Wi-Fi Calling.
  • Working of Voice over Wi-Fi: It works by utilizing Voice over Internet Protocol (VoIP) technology to transmit voice data as digital packets over an internet connection.
  • It's built directly into your phone's operating system and works seamlessly with your existing phone number and contacts.

Advantages of Voice over WiFi

  • It ensures clear and reliable connectivity in areas with weak mobile signal such as homes, offices, basements, and remote locations.
  • It helps reduce network congestion and is offered free of cost, with no additional charges for Wi-Fi calls.
  • It ensures clear and reliable connectivity in areas with weak mobile signals such as homes, offices, basements, and remote locations.

Source: PIB

Voice over WiFi FAQs

Q1: Which technology does VoWiFi use to transmit voice data?

Ans: Voice over Internet Protocol (VoIP) technology

Q2: What is the benefit of VoWiFi?

Ans: Better call quality in areas with poor cellular coverage

Countries and Capitals, Continent Wise List, Check Now

Countries and Capitals

List of Countries and Capitals helps in understanding the world geography, global affairs, and international relations. There are 195 recognized countries across continents, Asia, Africa, Europe, North and South America, and Oceania each with its own capital city that typically serves as the center of political authority, commerce, and cultural identity. In this article, you'll find a List of Countries and Capitals, including a special focus on India's neighboring countries and their capitals.

Countries and Capitals of Asia

Asia is the largest continent with a wide range of cultures, religions, languages, and political systems. It includes global powers like China and India, alongside smaller nations with unique identities. Asia plays a crucial role in world affairs. Knowing the countries and their capitals is essential for understanding international relations, trade, and cultural exchanges.

Countries and Capitals of Asia

S. No.

Country

Capital

1

Afghanistan

Kabul 

2

Armenia

Yerevan 

3

Azerbaijan 

Baku 

4

Bahrain

Manama 

5

Bangladesh

Dhaka 

6

Bhutan

Thimphu 

7

Brunei

Bandar Seri Begawan 

8

Cambodia

Phnom Penh 

9

China

Beijing 

10

Cyprus 

Nicosia 

11

East Timor 

Dili 

12

Georgia 

Tbilisi 

13

India

New Delhi 

14

Indonesia 

Jakarta 

15

Iran 

Tehran 

16

Iraq 

Baghdad 

17

Israel 

Jerusalem 

18

Japan 

Tokyo 

19

Jordan 

Amman 

20

Kazakhstan 

Nur-Sultan 

21

Kuwait 

Kuwait City 

22

Kyrgyzstan 

Bishkek

23

Laos

Vientiane 

24

Lebanon 

Beirut 

25

Malaysia 

Kuala Lumpur 

26

Maldives 

Male 

27

Mongolia 

Ulaanbaatar 

28

Myanmar 

Naypyidaw 

29

Nepal 

Kathmandu 

30

North Korea 

Pyongyang 

31

Oman 

Muscat 

32

Pakistan 

Islamabad 

33

Philippines 

Manila 

34

Qatar 

Doha 

35

Saudi Arabia 

Riyadh

36

Singapore 

Singapore 

37

South Korea 

Seoul 

38

Sri Lanka 

Sri Jayawardenepura Kotte

39

State of Palestine 

Jerusalem 

40

Syria 

Damascus 

41

Tajikistan 

Dushanbe 

42

Thailand 

Bangkok 

43

Turkey 

Ankara 

44

Turkmenistan 

Ashgabat 

45

United Arab Emirates 

Abu Dhabi 

46

Uzbekistan 

Tashkent 

47

Vietnam

Hanoi

48

Yemen

Sanaa

Countries and Capitals of Africa

Africa, the second-largest continent, is made up of 54 countries each with its own distinct culture, language, and history. It’s a region rich in natural resources, vibrant traditions, and growing economies. Find a list of Countries and Capitals of Africa.

Countries and Capitals of Africa

S. No.

Country

Capital

1

Algeria 

Algiers 

2

Egypt

Cairo 

3

Libya

Tripoli 

4

Morocco

Rabat 

5

Sudan

Khartoum 

6

Tunisia

Tunis 

7

Burundi

Gitega 

8

Comoros

Moroni 

9

Djibouti

Djibouti 

10

Eritrea

Asmara

11

Ethiopia

Addis Ababa 

12

Kenya

Nairobi 

13

Madagascar

Antananarivo 

14

Malawi

Lilongwe 

15

Mauritius

Port Louis 

16

Mozambique

Maputo 

17

Rwanda

Kigali 

18

Somalia Mogadishu

Mogadishu

19

South Sudan Juba

Juba

20

Tanzania Dodoma

Dodoma

21

Seychelles

Victoria 

22

Uganda

Kampala 

24

Zambia

Lusaka 

25

Zimbabwe 

Harare 

26

Angola

Luanda 

27

Cameroon

Yaounde 

28

Central African Republic

Bangui

29

Chad

N’Djamena 

30

Botswana 

Gaborone 

31

Burkina Faso

Ouagadougou 

32

Cabo Verde

Praia 

33

Congo, The Democratic Republic

Kinshasa

34

Congo Republic

Brazzaville 

35

Cote d’Ivoire

Yamoussoukro 

36

Equatorial Guinea

Malabo 

37

Eswatini (Swaziland)

Mbabane 

38

Gabon

Libreville 

39

Gambia

Banjul 

40

Ghana

Accra 

41

Guinea 

Conakry

42

Guinea-Bissau

Bissau

43

Lesotho

Maseru 

44

Liberia

Monrovia 

45

Mali

Bamako 

46

Mauritania 

Nouakchott 

47

Namibia

Windhoek 

48

Niger

Niamey 

49

Nigeria

Abuja 

50

Sao Tome and Principe

Sao Tome 

51

Senegal

Dakar 

52

Sierra Leone

Free Town 

53

South Africa

Pretoria 

54

Togo

Lome

Countries and Capitals of Australia/Oceania

Australia/Oceania is a unique region that includes the continent of Australia along with thousands of islands scattered across the Pacific Ocean. From the dry stretches of the Australian Outback to the dense rainforests of Papua New Guinea, this part of the world is rich in natural diversity and cultural depth. 

Countries and Capitals of Australia/Oceania

S. No.

Country

Capital

1

Australia 

Canberra

2

Fiji

Suva

3

Kiribati 

South Tarawa

4

Marshall Islands 

Majuro

5

Micronesia

Palikir

6

Nauru 

No official capital

7

New Zealand

Wellington 

8

Palau

Ngerulmud

9

Papua New Guinea

Port Moresby 

10

Samoa 

Apia

11

Solomon Islands

Honiara

12

Tonga 

Nukuʻalofa

13

Tuvalu

Funafuti Atoll 

14

Vanuatu

Port-Vila

Countries and Capitals of Europe

Europe is a continent in history, home to ancient civilizations like Greece and Rome and a driving force behind global developments in politics, science, and culture. It includes some of the world’s most powerful and influential nations, alongside smaller countries with equally rich heritage and identity. From monarchies to modern democracies, Europe has a complex and fascinating political landscape.

Countries and Capitals of Europe

S. No.

Country

Capital

1

Albania

Tirana 

2

Andorra

Andorra La Vella 

3

Austria

Vienna 

4

Belarus

Minsk 

5

Belgium

Brussels 

6

Bosnia and Herzegovina

Sarajevo

7

Bulgaria

Sofia 

8

Croatia

Zagreb 

9

Czech Republic

Prague 

10

Denmark

Copenhagen 

11

Estonia

Tallinn 

12

Finland

Helsinki 

13

France

Paris

14

Germany

Berlin 

15

Greece

Athens 

16

Vatican

Vatican City 

17

Hungary

Budapest 

18

Iceland

Reykjavik 

19

Ireland

Dublin 

20

Italy 

Rome 

21

Latvia

Riga 

22

Liechtenstein

Vaduz 

23

Lithuania

Vilnius 

24

Luxembourg

Luxembourg 

25

Macedonia

Skopje 

26

Malta

Valletta 

27

Moldova

Chisinau 

28

Monaco

Monaco 

29

Montenegro

Podgorica 

30

Netherlands

Amsterdam 

31

Norway

Oslo 

32

Poland

Warsaw 

33

Portugal

Lisbon 

34

Romania

Bucharest 

35

Russia

Moscow

36

San Marino

San Marino 

37

Serbia

Belgrade 

38

Slovakia

Bratislava

39

Slovenia

Ljubljana 

40

Spain

Madrid 

41

Sweden

Stockholm 

42

Switzerland

Bern 

43

Ukraine 

Kyiv 

44

United Kingdom

London

Countries and Capitals of North America

North America is a geographically and culturally diverse continent, having the vast Arctic regions of Canada, the economic and political influence of the United States, the historical richness of Mexico, and the distinct identities of the Caribbean nations.

Countries and Capitals of North America

S. No.

Country

Capital

1

Antigua and Barbuda

St. John's

2

Bahamas

Nassau

3

Barbados

Bridgetown

4

Belize

Belmopan

5

Canada

Ottawa

6

Costa Rica

San Jose

7

Cuba

Havana

8

Dominica

Roseau

9

Dominican Republic

Santo Domingo

10

El Salvador

San Salvador

11

Grenada

St. George's

12

Guatemala

Guatemala City

13

Haiti

Port-au-Prince

14

Honduras

Tegucigalpa

15

Jamaica

Kingston

16

Mexico

Mexico City

17

Nicaragua

Managua

18

Panama

Panama City

19

Saint Kitts and Nevis

Basseterre

20

Saint Lucia

Castries

21

Saint Vincent and the Grenadines

Kingstown

22

Trinidad and Tobago

Port of Spain

23

United States of America

Washington, D.C.

Countries and Capitals of South America

South America is the fourth largest continent by area and ranks fifth in terms of population. It is made up of 12 independent countries, each with distinct cultural traditions, historical backgrounds, and official languages. From the Andes mountains to the Amazon rainforest, the continent is known for its geographical diversity and natural resources. 

Countries and Capitals of South America

S. No.

Country

Currency

1

Argentina

Argentine peso

2

Bolivia

Bolivian boliviano 

3

Brazil 

Brazilian real

4

Chile

Chilean peso

5

Colombia

Colombian peso

6

Ecuador

United States dollar 

7

Falkland Islands (UK)

Falkland Islands pound

8

French Guiana (France)

European euro

9

Guyana

Guyanese dollar

10

Paraguay 

Paraguayan guarani

11

Peru

Peruvian sol

12

South Georgia Island (UK)

Pound sterling

13

Suriname 

Surinamese dollar

14

Uruguay

Uruguayan peso

15

Venezuela 

Venezuelan bolivar

List of Countries with Multiple Capitals

While most countries operate with a single capital that houses the central government and key administrative functions, a few nations have adopted a multi-capital structure. This arrangement often arises from historical circumstances, the need to balance political power, or efforts to improve administrative efficiency across regions. These countries may divide their executive, legislative, and judicial branches among different cities, or maintain separate political and economic capitals. In this section, we present a List of Countries with Multiple Capitals.

List of Countries with Multiple Capitals

S. No.

Country

Capitals

1

South Africa

Pretoria, Cape Town, and Bloemfontein

2

Sri Lanka

Sri Jayawardenepura Kotte and Colombo

3

Benin

Porto-Novo and Cotonou

4

Bolivia

Sucre and La Paz

5

Chile

Santiago and Valparaiso

6

Côte d’Ivoire

Yamoussoukro and Abidjan

7

Georgia

Tbilisi and Kutaisi

8

Malaysia

Kuala Lumpur and Putrajaya

9

Montenegro

Podgorica and Cetinje

10

Netherlands

Amsterdam and The Hague

11

Swaziland

Mbabane and Lobamba

12

Yemen

Sana and Aden

13

Tanzania

Dodoma and Dar es Salaam

Neighboring Countries of India and Their Capitals

India, the seventh-largest country in the world by area, shares its land borders with a number of neighboring nations, each with distinct cultural identities, historical backgrounds, and languages. These countries play a significant role in shaping the regional geopolitics of South Asia.

Neighboring Countries of India and Their Capitals

S. No.

Country

Capital

1

Bhutan

Thimphu

2

Nepal

Kathmandu

3

Sri Lanka

Srijaywardhanepuram

4

Pakistan

Islamabad

5

China

Beijing

6

Myanmar

Naypidaw

7

Bangladesh

Dhaka

8

Afghanistan

Kabul

9

Maldives

Male

List of Countries and Capitals FAQs

Q1: What is a capital city?

Ans: A capital city is the administrative, political, or cultural center of a country where its government is usually located.

Q2: Which country has the most capital cities?

Ans: South Africa has three capitals: Pretoria (executive), Cape Town (legislative), and Bloemfontein (judicial).

Q3: What is the capital of India?

Ans: New Delhi is the capital of India and the seat of all three branches of the Indian government.

Q4: Which is the smallest capital city in the world?

Ans: Ngerulmud, the capital of Palau, is among the smallest by population.

Q5: Which is the highest capital city in the world?

Ans: La Paz, Bolivia, is the highest capital city at around 3,640 meters above sea level.

Cellulitis

Cellulitis

Cellulitis Latest News

An observational study about Cellulitis was published in the  International Journal of Lower Extremity Wounds. 

About Cellulitis

  • Cellulitis is a common skin infection caused mostly by streptococcus and staphylococcus bacteria.
  • Common Sites: It can affect the tissues beneath the skin and can affect any part of the body such as the face, arms, hands and fingers it usually affects the legs, feet and toes.
  • Risk factor: Anyone can contract cellulitis, but persons with skin wounds, or compromised immune systems, which allows the bacteria to enter easily, are at higher risk.
  • Cellulitis is not contagious but in rare cases if you have an open wound and have skin-to-skin contact with an infected person’s open wound.

Symptoms of Cellulitis

  • Infected skin may appear slightly discoloured, and warm to touch. As the infection spreads, the discolouration darkens and the skin swells and becomes tender.
  • A person could have fever, feel fatigued, experience chills, develop spots on the skin, blisters filled with fluid and dimpling of the skin. 
  • Treatment: It usually consists of a course of oral antibiotics. Severe cases may need hospitalisation and IV antibiotics.

Source: TH

Cellulitis FAQs

Q1: What is the most common cause of Cellulitis?

Ans: Bacterial infection (Streptococcus and Staphylococcus)

Q2: What is a common symptom of Cellulitis?

Ans: Redness and warmth of skin

Skilling for AI Readiness (SOAR) Programme

Skilling for AI Readiness (SOAR) Programme

Skilling for AI Readiness (SOAR) Programme Latest News

Recently, the President of India graced a special programme under SOAR initiative.

About Skilling for AI Readiness (SOAR) Programme

  • It is an initiative of the Ministry of Skill Development and Entrepreneurship (MSDE).
  • Aim: It aims to integrate artificial intelligence learning into India’s school education and training ecosystem, preparing both students and teachers for a rapidly evolving digital world.
  • It has a vision to position India as a global leader in AI by preparing its youth for AI-driven careers and entrepreneurial ventures.

Features of Skilling for AI Readiness (SOAR) Programme

  • Target: It focuses on school students from classes 6 to 12 and educators across India.
  • Course: It offers three targeted 15-hour modules for students and a 45-hour module for teachers.
  • These courses introduce foundational AI and machine learning concepts, along with data literacy and the ethical use of technology.
  • Funding: To this government provided ₹500 crore to establish a Centre of Excellence in Artificial Intelligence for Education.
    • The centre will focus on developing AI-based learning tools, promoting multilingual AI resources for Indian languages, and fostering innovative classroom practices.
    • It will also strengthen AI curriculum development across technical institutions and complement existing efforts by IITs and AICTE-approved colleges that already offer advanced courses in machine learning, deep learning, and data analytics.

Source: PIB

Skilling for AI Readiness (SOAR) Programme FAQs

Q1: What is the primary objective of the Skilling for AI Readiness (SOAR) Programme?

Ans: To equip students and educators with AI skills

Q2: Which ministry launched the SOAR Programme?

Ans: Ministry of Skill Development and Entrepreneurship

Eastern Imperial Eagle

Eastern Imperial Eagle

Eastern Imperial Eagle

Wildlife enthusiasts recently confirmed the presence of an Eastern Imperial Eagle visiting the Mudumalai Tiger Reserve (MTR) during the winter migratory season.

About Eastern Imperial Eagle

  • It is a large bird of prey.
  • Scientific Name: Aquila heliaca

Eastern Imperial Eagle Distribution

  • It breeds in southeastern Europe and extensively through West and Central Asia. 
  • Most populations are migratory and winter in northeastern Africa, the Middle East and South and East Asia.
  • Like all eagles, the eastern imperial eagle is a member of the family Accipitridae. Furthermore, its well feathered legs mark it as a member of the subfamily Aquilinae.

Eastern Imperial Eagle Features

  • It is the second largest eagle to reside in Europe. It can grow to a length of about 0.92 meters. 
  • It can have a wingspan approaching 2.14 meters and have a mass of about 3.6 kilograms. 
  • The species displays reverse sexual dimorphism, as do most birds of prey, in which males are usually smaller than the females.
  • Adults are black-brown in color. They have a pale golden crown and nape and a grey base that extends to the tail. 
  • Like other eagles, they have strong legs and feet. Their feet include long, curved talons that they use to seize, kill, and carry their prey.
  • Average lifespan: 56 years

Eastern Imperial Eagle Conservation Status

It is classified as 'Vulnerable' under the IUCN Red List.

Mudumalai Tiger Reserve (MTR)

  • It is located in the Nilgiris District of Tamil Nadu, spread over 321 sq. km. at the tri-junction of three states, viz., Karnataka, Kerala, and Tamil Nadu.
  • It lies on the northeastern and northwestern slopes of the Nilgiri hills, which is a part of the Western Ghats.
  • It is part of the Nilgiris Biosphere Reserve, the first biosphere reserve in India.
  • The name Mudumalai means ”the ancient hill range”. Indeed, it is as old as 65 million years, when the Western Ghats were formed.
  • Habitat: A variety of habitats ranging from tropical evergreen forest, moist deciduous forest, moist teak forest, dry teak forest, secondary grasslands, and swamps are found here.
  • River: The Moyar River runs through the reserve.
  • The Oscar-winning ‘Elephant Whisperers’ was filmed at the Theppakadu Elephant Camp, located inside the Mudumalai Tiger Reserve.
  • Flora:
    • It has tall grasses, commonly referred to as “Elephant Grass”, bamboo of the giant variety, and valuable timber species like teak, rosewood, etc.
    • It has wild relatives of cultivated plants, viz., wild rice, ginger, turmeric, cinnamon, etc.
    • The habitat also has swampy areas (Vayals) and grasslands.
  • Fauna:
    • The faunal assemblage includes: elephant, gaur, sambar, four-horned antelope, spotted deer, barking deer, blackbuck, wild pig, mouse deer, and predators like tigers, leopards, and wild dogs.
    • Around 8% of the total bird species in India can be found in the region.

Source: TH

Eastern Imperial Eagle FAQs

Q1: Where does the Eastern Imperial Eagle primarily breed?

Ans: It breeds in southeastern Europe and extensively through West and Central Asia.

Q2: Where do most populations of the Eastern Imperial Eagle winter?

Ans: They winter in northeastern Africa, the Middle East, and South and East Asia.

Q3: What are the typical colours of the adult Eastern Imperial Eagle?

Ans: Adults are black-brown with a pale golden crown and nape and a grey base extending to the tail.

Q4: What is the IUCN Red List status of the Eastern Imperial Eagle?

Ans: Vulnerable

Ganga River System, Tributaries, Origin, Map, Length

Ganga River System

The Ganga River System is also known as the Ganges River System, an extensive and intricate network of rivers, tributaries, distributaries, and wetlands covering multiple states in northern India and parts of Bangladesh. The Ganga River is already considered sacred in Hinduism and holds immense religious importance. It is one of the most significant river systems in the world, supporting a vast population and influencing the cultural, religious, and economic landscape of the region. The Ganga originates in the Himalayas and flows through the fertile Indo-Gangetic Plain. It eventually drains into the Bay of Bengal, forming the Ganges-Brahmaputra Delta, one of the largest river deltas in the world.

Ganga River System

The Ganga River is one of the major rivers of the Himalayan drainage system and the most sacred river in India. Flowing through northern and eastern India, it forms the largest river basin of the country, supporting diverse flora, fauna, and human settlements.
Key facts include:

  • It stretches over 2,500 km, making it one of Asia’s longest rivers.
  • It forms a complex network of Himalayan and Peninsular tributaries.
  • It sustains numerous cities, farmlands, and industries across its basin.
  • It holds immense spiritual significance in Hindu traditions, rituals, and pilgrimages.

Ganga River System Origin

The Ganga originates as the Bhagirathi River from the Gangotri Glacier at Gaumukh in Uttarakhand at an elevation of 3,892 m. After merging with the Alaknanda River at Devprayag, the stream is officially named Ganga.

Flowing for nearly 2,525 km, the Ganga passes through the states of Uttarakhand, Uttar Pradesh, Bihar, Jharkhand, and West Bengal, touching the lives of millions. It forms one of the world's most densely populated basins, accounting for 26.4% of India’s geographical area and supporting nearly 50% of India’s population.

  • Origin: Gaumukh (Gangotri Glacier), Uttarakhand
  • Source Stream: Bhagirathi
  • Total Length: ~2,525 km
  • Major States: Uttarakhand → UP → Bihar → Jharkhand → West Bengal
  • Final Drainage: Bay of Bengal

Ganga River System Map

The Ganga River System is the largest and most sacred river network in India, playing a central role in the country's cultural, spiritual, and ecological landscape. A Ganga River System Map illustrates the origin, major tributaries, and extensive drainage basin of the Ganga River, which spans multiple states across northern and eastern India before emptying into the Bay of Bengal.

[my_image src="https://vajiramandravi.com/current-affairs/wp-content/uploads/2025/11/ganga-river-system-map.webp" size="full" align="center" width="auto" height="299px" alt="ganga-river-system-map" title="ganga-river-system-map"]

Course of the Ganga River System

The course of Ganga can be divided into three major sections: Upper Course, Middle Course, and Lower Course, shaped by Himalayan terrain, alluvial plains, and deltaic regions.

Upper Course (Himalayan Region)

This part features steep gradients, rapids, and narrow gorges.

  • Bhagirathi meets Alaknanda at Devprayag → River named Ganga
  • Enters plains at Haridwar
  • Barrages at Haridwar, Bijnor, and Narora divert water to Upper, Madhya, and Lower Ganga Canals

Middle Course (Indo-Gangetic Plains)

From Haridwar to Bihar, the river becomes wider and supports dense agricultural activity.

  • Joined by major tributaries: Ramganga, Yamuna, Gomti, Ghaghara, Gandak, Kosi
  • Plains provide extremely fertile alluvial soil
  • River meanders widely due to low gradient

Lower Course (Bengal Region)

The river slows down and splits into distributaries forming the world's largest delta.

  • Farakka Barrage regulates flow
  • Ganga splits into Bhagirathi-Hooghly (right) and Padma (left)
  • Padma enters Bangladesh and joins Brahmaputra & Meghna
  • Dense mangrove forests (Sundarbans) formed by tidal influence

Ganga River System Tributaries

The Ganga River System is fed by various tributaries and sub-tributaries, which are categorized into right-bank and left-bank tributaries depending on their position relative to the main source (the Ganga).

Ganga River System Right Bank Tributaries

The Ganga River System is one of the most extensive and sacred river systems in India. It originates from the Gangotri Glacier in Uttarakhand and flows through the northern plains, nourishing millions of lives. The river receives several right bank tributaries, mainly from the southern side of its flow. The major right-bank tributaries joining the Ganga River include:

  • Yamuna River
  • Tons (Tamsa) River
  • Son (Sone) River
  • Punpun River
  • Chandan River
  • Phalgu (Niranjana) River
  • Kiul River
  • Karamnasa River

1. Yamuna River

The Yamuna is the largest and most important right-bank tributary of the Ganga. It originates from the Yamunotri Glacier in Uttarakhand and flows through major urban and agricultural centers.

  • Originates at 6,387 meters in the Himalayas.
  • Passes through Haryana, Delhi, and Uttar Pradesh.
  • Major tributaries: Chambal, Betwa, Ken, Hindon.
  • Joins the Ganga at Allahabad (Prayagraj) at the Triveni Sangam.

Importance

  • Essential for irrigation in the Yamuna–Ganga Doab.
  • Provides water to Delhi and surrounding regions.
  • Associated with ancient Indian civilization and heritage.

2. Tons (Tamsa) River

The Tons River is an important right-bank tributary flowing through central India.

  • Originates in the Kaimur Range, Madhya Pradesh.
  • Known for waterfalls like the Chachai Falls.
  • Flows through Madhya Pradesh and Uttar Pradesh.

Importance

  • Supports local irrigation and agriculture.
  • Carries seasonal monsoon flows essential for eastern UP plains.

3. Son (Sone) River

The Son River is a major right-bank tributary with a large basin area.

  • Originates from the Amarkantak Plateau, Madhya Pradesh.
  • Longest right-bank tributary after the Yamuna.
  • Flows through MP, UP, Jharkhand, Bihar.
  • Known for the Indrapuri Barrage in Bihar.

Importance

  • Major irrigation projects for Bihar and UP.
  • Alluvial plains formed by the river are agriculturally fertile.

4. Punpun River

The Punpun River flows parallel to the Ganga and drains eastern Bihar.

  • Originates in Palamu Hills of Jharkhand.
  • Flows through Gaya, Patna.
  • Joins the Ganga near Fatuha in Bihar.

Importance

  • Crucial for local farming in Bihar’s plains.
  • Religious mention in the Puranas as a sacred river.

5. Chandan River

A small right-bank tributary located in Bihar and Jharkhand.

  • Originates in Jharkhand’s hills.
  • Flows into Bihar’s plains and merges with the Ganga.

Importance

  • Supports agriculture and groundwater recharge.
  • Plays a role in small-scale irrigation.

6. Phalgu (Niranjana) River

The Phalgu River is historically significant due to its association with Bodh Gaya.

  • Formed by the merging of Niranjana and Mohana rivers.
  • Flows through Gaya in Bihar.
  • Eventually drains into the Punpun River.

Importance

  • Considered sacred by Hindus and Buddhists.
  • Important for religious rituals in Gaya (Pind Daan).

Ganga River System Left Bank Tributaries

The Ganga River System, one of the largest in the world, receives numerous tributaries that join it from the northern Himalayan side. These are known as the left-bank tributaries. They originate mainly in the Himalayas, making them perennial rivers with high discharge, rich sediments, and strong ecological influence. The major left-bank tributaries of the Ganga include:

  • Ramganga River
  • Gomti River
  • Ghaghara (Karnali) River
  • Gandak River
  • Kosi River
  • Mahananda River

1. Ramganga River

The Ramganga River originates in the Doodhatoli Range of Uttarakhand and flows through the Jim Corbett National Park before entering the plains. It contributes significantly to irrigation and water supply in western Uttar Pradesh. The river joins the Ganga near Kannauj, increasing its discharge.

  • Origin: Doodhatoli Hills, Uttarakhand
  • Passes through Corbett National Park
  • Joins Ganga near Kannauj

2. Gomti River

The Gomti River originates from Gomat Taal in Pilibhit and flows entirely through the plains of Uttar Pradesh. It passes through major cities like Lucknow and Sultanpur, serving as an important water source. The river meets the Ganga at Ghazipur.

  • Origin: Gomat Taal, Pilibhit (UP)
  • Major cities: Lucknow, Sultanpur, Jaunpur
  • Joins Ganga at Ghazipur

3. Ghaghara (Karnali) River

The Ghaghara River rises in the Tibetan Plateau near Lake Mansarovar and flows through Nepal before entering India. It is one of the largest and most powerful tributaries, bringing heavy sediments and causing floods. The river joins the Ganga at Chhapra in Bihar.

  • Origin: Mapchachungo Glacier, Tibet
  • Known as Karnali in Nepal
  • Joins Ganga at Chhapra (Bihar)

4. Gandak River

The Gandak River originates in the Himalayas of Nepal from the Nhubine Himal Glacier. It flows southward through deep valleys and brings nutrient-rich alluvium to Bihar. The river meets the Ganga near Patna.

  • Origin: Nhubine Himal Glacier (Nepal)
  • Known as Kali Gandaki/Narayani in Nepal
  • Joins Ganga near Patna

5. Kosi River

The Kosi River originates in Tibet and enters India after flowing through eastern Nepal. Known as the “Sorrow of Bihar,” it frequently shifts its course due to heavy sediment load. The river merges with the Ganga at Kursela in Bihar.

  • Origin: Tibet (Saptakoshi system)
  • Causes widespread floods in Bihar
  • Joins Ganga at Kursela

6. Mahananda River

The Mahananda River rises in the Darjeeling Hills and flows through Bihar and West Bengal before entering Bangladesh. It is the easternmost major tributary of the Ganga and influences the hydrology of North Bengal. The river finally joins the Ganga near Godagari.

  • Origin: Darjeeling Hills (WB)
  • Flows through Bihar & North Bengal
  • Joins Ganga near Godagari (Bangladesh)

Ganga River System Cities

The Ganga River flows through several historically, culturally, and economically significant cities in India. These cities have flourished along the river due to fertile lands, trade routes, and religious importance. Many of them, like Haridwar, Varanasi, and Kolkata, serve as major pilgrimage destinations and urban centers. Here is the list of Major Cities located on the bank of Ganga River.

  • Srinagar (Uttarakhand) – Known for its ancient temples and scenic Himalayan surroundings.
  • Rishikesh (Uttarakhand) – Global hub of yoga and spirituality; gateway to the Himalayas.
  • Haridwar (Uttarakhand) – One of the holiest Hindu cities; site of Kumbh Mela and ritual bathing ghats.
  • Roorkee (Uttarakhand) – Known for IIT Roorkee and colonial-era canal systems.
  • Bijnor (Uttar Pradesh) – A significant agricultural and sugarcane belt along the Ganga.
  • Narora (Uttar Pradesh) – Home to Narora Atomic Power Station and Ganga barrage.
  • Kannauj (Uttar Pradesh) – Famous for attar (perfume), ancient trade center on Ganga bank.
  • Kanpur (Uttar Pradesh) – Major industrial city known for leather, textiles, and IIT Kanpur.
  • Prayagraj (Uttar Pradesh) – Site of the Triveni Sangam; hosts the world-famous Kumbh Mela.
  • Varanasi (Uttar Pradesh) – One of the world’s oldest cities; a major cultural, spiritual, and educational hub.
  • Mirzapur (Uttar Pradesh) – Known for carpets, handicrafts, and its scenic ghats.
  • Patna (Bihar) – One of India’s oldest continuously inhabited cities; political and cultural hub.
  • Bhagalpur (Bihar) – Known for silk production and Vikramshila ruins.
  • Behrampore (West Bengal) – Important town in Murshidabad district along the river.
  • Serampore (West Bengal) – Known for colonial heritage and educational institutions.
  • Howrah (West Bengal) – Industrial hub; connected to Kolkata by the iconic Howrah Bridge.
  • Kolkata (West Bengal) – Major metropolitan city; cultural capital of India and major port city on the Hooghly (Ganga distributary).

Dams on the Ganga River System

The Ganga River System contains several major dams and barrages that play a vital role in hydropower generation, irrigation, flood control, and water management across northern India. These structures support agriculture, drinking water supply, and regional development in Uttarakhand, Uttar Pradesh, Bihar, West Bengal, and adjoining states.

Dam / Project River Location State Purpose / Key Features
Tehri Dam Bhagirathi (Ganga headstream) Tehri Uttarakhand 2,400 MW hydropower; irrigation, drinking water; one of the world’s tallest dams
Koteshwar Dam Bhagirathi Koteshwar Uttarakhand Acts as balancing reservoir for Tehri Dam; hydropower
Maneri Bhali I & II Bhagirathi Uttarkashi Uttarakhand Hydroelectric generation: 90 MW (Stage I) + 304 MW (Stage II)
Ramganga Dam (Kalagarh Dam) Ramganga Kalagarh Uttarakhand Multipurpose: irrigation, hydropower, flood control; located near Corbett NP
Narora Barrage Ganga Bulandshahr Uttar Pradesh Supplies water for irrigation; regulates flow near Narora Atomic Power Station
Kanpur Barrage Ganga Kanpur Uttar Pradesh Ensures urban water supply & irrigation regulation
Farakka Barrage Ganga Murshidabad West Bengal 2304 m long; diverts water into Hooghly River to maintain Kolkata Port
Gandak Barrage / Project Gandak Valmikinagar Bihar Indo–Nepal project for irrigation, flood control & hydropower
Kosi Project (Kosi Barrage) Kosi Birpur Bihar Major flood control & irrigation system; Indo–Nepal collaboration
Rihand Dam Rihand (tributary of Son) Pipri, Sonebhadra Uttar Pradesh India’s largest reservoir (Govind Ballabh Pant Sagar); hydropower + irrigation
Bansagar Dam Son Shahdol Madhya Pradesh Joint MP–UP–Bihar irrigation project; hydropower generation
Matatila Dam Betwa (Yamuna tributary) Lalitpur Uttar Pradesh Hydropower, irrigation, regional water supply
Chambal Project (Gandhi Sagar, Rana Pratap Sagar & Jawahar Sagar Dams) Chambal (Yamuna tributary) MP–Rajasthan Multipurpose hydropower & irrigation system across three major dams  
Damodar Valley Project Damodar Jharkhand & West Bengal Flood control, hydropower, irrigation; India’s first multipurpose river valley project  
Durgawati Dam Durgawati (Karmanasa tributary) Kaimur Bihar Under construction; drinking water + irrigation supply

Ganga-Brahmaputra Delta

Before merging into the Bay of Bengal, the Ganga and Brahmaputra together form the world's largest delta, situated between the Bhagirathi-Hooghly and the Padma-Meghna rivers. The coastline of this delta features a highly indented and complex landscape. Comprising a network of distributaries and islands, the region is covered by dense mangrove forests. A significant portion of the Ganga-Brahmaputra Delta consists of low-lying swamps that frequently cause flooding by seawater during high tides.

Government Initiatives for Cleaning the Ganga River

The Ganga River is not only vital for India’s ecology and economy but also holds immense cultural and spiritual significance. Over the years, pollution from industrial, domestic, and agricultural sources has severely impacted its water quality. To restore and maintain the health of the river, the Government of India has launched several initiatives aimed at cleaning, conserving, and rejuvenating the Ganga River and its tributaries.

1. Namami Gange Programme (2014)

  • Launched in 2014 by the Ministry of Jal Shakti.
  • Objectives: Sewage treatment, riverfront development, industrial effluent control, afforestation along riverbanks.
  • Integrated mission with a budget of over ₹20,000 crore for cleaning the Ganga and its tributaries.

2. Ganga Action Plan (GAP I & II)

  • GAP-I (1986–2000): First major effort to control pollution in major cities along the Ganga.
  • GAP-II (1993–2000): Focused on additional towns and river stretches.
  • Key measures included sewage treatment plants (STPs), public awareness campaigns, and industrial waste control.

3. National Ganga River Basin Authority (NGRBA)

  • Established in 2009 under the Ministry of Environment & Forests.
  • Objective: Coordinated management and pollution control of the Ganga basin.
  • Responsible for implementing policies and monitoring water quality across multiple states.

4. River Surface Cleaning Initiatives

  • Deployment of floating trash skimmers and manual cleaning drives.
  • Focus on plastic, industrial debris, and solid waste removal from riverbanks and ghats.

5. Afforestation and Biodiversity Programs

  • Plantation of trees along riverbanks to reduce soil erosion.
  • Protection of aquatic species like the Ganges river dolphin and Gharial.

Economic Importance of the Ganga River System

The Ganga River is one of India’s most economically significant rivers, supporting agriculture, industry, fisheries, tourism, and inland navigation. Its fertile plains, abundant water supply, and navigable stretches make it a backbone for regional livelihoods and contribute substantially to the national economy.

  • The Ganga River supports irrigation across Uttar Pradesh, Bihar, Jharkhand, and West Bengal, enabling cultivation of rice, wheat, sugarcane, and other crops.
  • Its fertile alluvial plains contribute to high agricultural productivity and food security in northern India.
  • The river provides habitat for freshwater fish and supports livelihoods of fishermen along its banks.
  • It supplies water for industries in cities like Kanpur, Varanasi, and Kolkata, including textiles, leather, paper, and chemical sectors.
  • Navigable stretches of the Ganga form part of National Waterway-1, facilitating transport of goods like coal, cement, and food grains.
  • Pilgrimage and tourism along the river, including sites like Haridwar, Varanasi, and Prayagraj, contribute significantly to local and regional economies.
  • Hydropower projects like Tehri Dam and Maneri Bhali generate electricity, support irrigation, and control floods in multiple states.
  • Sand, silt, and gravel extracted from the Ganga are used in construction, supporting local economies.
Also Check Other River System
Godavari River System Tapti River System
Kaveri River System Mahanadi River System
Ganga River System Narmada River System
Yamuna River System Krishna River System
Indus River System
Brahmaputra River System

Ganga River System FAQs

Q1: What is the system of the Ganga River?

Ans: The Ganga drainage system, also known as the Ganga river basin, is a large river system that includes the Ganga river and its tributaries.

Q2: What are the 7 streams of Ganga?

Ans: The seven streams of Ganga are Bhagirathi, Janhvi, Bhilangana, Mandakini, Rishiganga, Saraswati and Alaknanda which merge into Ganga at Devprayag.

Q3: What is the flow of the Ganges River system?

Ans: The Ganga River System flows from northwest to southeast.

Q4: What are the 3 parts of Ganga?

Ans: The important among these are Alaknanda, Dhauliganga, Pindar, Mandakini and Bhilangana.

Q5: Who is the father of Ganga?

Ans: The father of Ganga was Himavan.

Venezuela

Venezuela

Venezuela Latest News

Recently, the U.S. military has launched large-scale strikes inside Venezuela, with explosions heard in multiple areas, including the capital Caracas.

About Venezuela

  • Location: It is located on the northern coast of South America.
  • Bordering Countries: It is bounded by Guyana to the east, Brazil to the south, and Colombia to the southwest and west. 
  • Maritime boundaries: It shares a border with the Caribbean Sea and the Atlantic Ocean to the north.
  • Capital: Caracas.

Geographical Features of Venezuela

  • Terrain: Andes Mountains and Maracaibo Lowlands in northwest; central plains (llanos); Guiana Highlands in southeast
  • Major Rivers: Rio Negro (shared with Colombia and Brazil) and Orinoco (shared with Colombia).
  • Major Lakes:  Lake Guri and Lake Maracaibo (the largest lake in South America).
  • Highest Point: Pico Bolivar 
  • The world’s highest waterfall – the Andes Mountains Angel Falls is located in the Guiana Highlands.
  • Natural Resources: It is home to the world’s largest oil reserves as well as huge quantities of coal, iron ore, bauxite, and gold.

Source: IE

Venezuela FAQs

Q1: Where is Venezuela located?

Ans: South America

Q2: What is the capital of Venezuela?

Ans: Caracas

Land Acquisition in India and Infrastructure Delays

Land Acquisition

Land Acquisition Latest News

  • Land acquisition has been flagged as the single largest cause of delays in major infrastructure projects reviewed under the PRAGATI mechanism

Understanding Land Acquisition in India

  • Land acquisition is the process through which the government acquires private land for public purposes such as infrastructure development, industrial corridors, housing, defence projects, and social infrastructure. 
  • In India, this process has long been sensitive due to tensions between development objectives and the rights of landowners, farmers, and local communities.
  • Given India’s ambitious infrastructure and industrial growth plans, land acquisition plays a foundational role in enabling economic expansion. 
  • However, it also remains one of the most contested areas of public policy.

Legal Framework Governing Land Acquisition

  • The present legal framework is governed by the Right to Fair Compensation and Transparency in Land Acquisition, Rehabilitation and Resettlement Act, 2013 (LARR Act)
  • This law replaced the colonial-era Land Acquisition Act of 1894 and aimed to make the acquisition process more humane, transparent, and participatory.
  • Key features of the Act include mandatory: 
    • Social Impact Assessment (SIA), 
    • Consent requirements for private and public-private partnership projects, 
    • Enhanced compensation linked to market value, 
    • Comprehensive rehabilitation and 
    • Resettlement provisions for affected families

Compensation and Rehabilitation Provisions

  • Under the LARR Act, compensation is calculated based on market value, with higher multipliers for rural areas and additional solatium. 
  • The law also mandates rehabilitation measures such as housing, employment or annuity options, and provision of basic infrastructure for displaced families.
  • These provisions were designed to address historical grievances where communities were displaced without adequate compensation or livelihood support.

Procedural and Administrative Challenges

  • Despite its progressive intent, land acquisition remains a slow and complex process. 
  • SIAs often take considerable time, consent requirements are difficult to fulfil in areas with fragmented landholdings, and valuation disputes frequently lead to litigation.
  • Additionally, coordination challenges between Central ministries, State governments, and district administrations further delay acquisition timelines. 
  • Since land is a State subject, differences in administrative capacity and political priorities across States add to implementation difficulties.

Impact on Infrastructure Projects

  • Large infrastructure projects such as highways, railways, power plants, industrial parks, and urban transport systems are especially vulnerable to land-related delays. 
  • In many cases, projects face cost overruns and time overruns due to unresolved land disputes, even after financial and technical approvals have been secured.
  • As a result, land acquisition has emerged as a structural bottleneck in India’s infrastructure-led growth strategy.

News Summary

  • Recent reviews of major infrastructure projects under the PRAGATI (Pro-Active Governance and Timely Implementation) mechanism have once again highlighted land acquisition as the single largest cause of project delays.
  • Official assessments indicate that nearly 35% of unresolved issues in large infrastructure projects are directly related to land acquisition, making it the most significant impediment compared to forest clearances, environmental approvals, utility shifting, or law-and-order issues.

Government’s Current Policy Position

  • Despite the scale of the problem, the government has clarified that there is no proposal to amend or dilute the existing land acquisition law
  • Instead, the focus is on improving administrative coordination, timely escalation of disputes, and strengthening Centre–State cooperation.
  • Through PRAGATI, unresolved issues are escalated from line ministries to higher institutional levels, enabling faster decision-making and accountability.

Role of Monitoring and Coordination Mechanisms

  • The PRAGATI platform has reviewed over 3,300 projects involving investments worth approximately Rs. 85 lakh crore. 
  • Many long-pending projects, some dating back to the 1990s, have been completed due to sustained monitoring and inter-governmental coordination.
  • Although precise fiscal savings have not been quantified, faster project execution has helped unlock stalled investments and reduce economic losses caused by delays.

Way Forward

  • The recent reviews reinforce that while strong legal safeguards for landowners are necessary, efficient administration, early stakeholder engagement, and cooperative federalism are equally critical. 
  • Rather than legislative changes, the emphasis is on better implementation, dispute resolution, and institutional coordination.
  • For India to meet its infrastructure and development goals, land acquisition reforms must focus on execution efficiency while maintaining the balance between development needs and social justice.

Source: TH | IE

Land Acquisition FAQs

Q1: Which law governs land acquisition in India?

Ans: The Right to Fair Compensation and Transparency in Land Acquisition, Rehabilitation and Resettlement Act, 2013 governs land acquisition.

Q2: Why does land acquisition delay infrastructure projects?

Ans: Delays arise due to consent requirements, Social Impact Assessments, disputes over compensation, and litigation.

Q3: What is PRAGATI in infrastructure governance?

Ans: PRAGATI is a monitoring platform that reviews and resolves implementation issues in major infrastructure projects.

Q4: What share of project delays is linked to land acquisition?

Ans: Around 35% of unresolved issues in large projects are related to land acquisition.

Q5: Is the government planning to change the land acquisition law?

Ans: No, the government has stated that there is no plan to amend the existing land acquisition law.

Carbon Credits: A New Income Stream for Rice Farmers via AWD

AWD

AWD Latest News

  • Getting farmers to adopt climate-friendly practices is challenging, especially when it involves high upfront costs, new machinery, or risks of yield loss. The challenge is sharper in India, where over 86% of farmers are small or marginal, holding 2 hectares or less. 
  • In this context, low-effort, high-impact agricultural practices become crucial. One such practice in rice cultivation is Alternate Wetting and Drying (AWD), which offers climate benefits without heavy investment or productivity losses.

Traditional Rice Cultivation and Methane Emissions

  • In traditional rice cultivation, paddy seeds are first raised in nurseries and transplanted after 25–30 days into the main field, which is about ten times larger than the nursery area. 
  • After transplantation, the crop typically grows for 90–100 days, extending to 120 days or more for some varieties.
  • For nearly the first 65 days of the cropping period, fields are kept continuously flooded with 4–5 cm of standing water. 
  • This practice mainly helps suppress weeds by creating oxygen-deficient conditions that prevent weed seed germination. 
  • Flooding becomes less necessary after the vegetative growth and tillering stage, when panicle formation begins.

Methane Formation in Flooded Fields

  • Continuous flooding creates an anaerobic soil environment, ideal for methanogenic microbes that decompose organic matter. 
  • During this process, carbon from plant residues reacts with hydrogen from water, producing methane.
  • Methane is a highly potent greenhouse gas, with a global warming potential about 28 times greater than carbon dioxide over a 100-year period, making flooded rice cultivation a significant contributor to agricultural emissions.

Alternate Wetting and Drying (AWD): A Climate-Friendly Alternative

  • Alternate Wetting and Drying (AWD) replaces continuous flooding with periodic drying and re-flooding of paddy fields. 
  • This breaks the anaerobic conditions that favour methane-producing microbes, thereby reducing emissions.

AWD Schedule in Practice

  • Farmers are advised to:
    • Keep fields flooded for the first 20 days after transplantation
    • During days 21–65, allow the field to dry for two cycles of six days each, draining water to 10–15 cm below the soil surface before re-flooding

Field Evidence from Telangana

  • A study by Mitti Labs Ltd during the 2024 kharif season covered 30 paddy fields across three villages in Warangal district.
    • 15 fields followed AWD
    • 15 fields followed continuous flooding (CF)
  • Water use: AWD fields used 3.14 million litres per acre, compared to 4.96 million litres under CF
  • Methane emissions: AWD emitted 3.5 tonnes CO₂-equivalent per hectare, versus 6 tonnes under CF
  • Crucially, grain yields remained unchanged at about 2.5 tonnes per acre under both AWD and CF.
  • This makes AWD a low-effort, high-impact practice that conserves water and cuts emissions without affecting productivity.

Carbon Credits: A New Income Stream for Rice Farmers

  • Alternate Wetting and Drying (AWD) offers farmers more than resource efficiency. 
  • Experts highlight AWD’s potential to generate carbon credits, enabling farmers to monetise methane reductions.
  • Carbon credits are built on direct methane measurements using field chambers, laboratory analysis, geo-tagging, boundary mapping, and satellite imagery—creating a rigorous monitoring, reporting, and verification (MRV) system suitable for domestic and international markets.
  • Data centres, airlines, and other energy- and water-intensive industries purchase credits to offset emissions and meet net-zero targets, driving demand for verified agricultural abatement.

Farmer Earnings Potential

  • Methane abatement credits trade at $15–25 per tonne CO₂e.
  • With ~2.5 tCO₂e/ha reduced per crop, farmers can earn ~$37.5/ha—about ₹3,367 per hectare (₹1,363 per acre) per crop.
  • With India the world’s largest rice producer and exporter, AWD-linked carbon markets present a scalable, farmer-friendly pathway to raise incomes while cutting emissions—an opportunity whose time has arrived.

Source: IE | IREF

AWD FAQs

Q1: Why are carbon credits relevant for rice farmers in India?

Ans: Rice farming emits methane, a potent greenhouse gas. By reducing emissions through improved practices, farmers can earn carbon credits and generate additional income.

Q2: What is Alternate Wetting and Drying (AWD)?

Ans: AWD is a rice cultivation method that periodically dries fields instead of continuous flooding, reducing methane emissions and water use without lowering crop yields.

Q3: How does AWD reduce methane emissions?

Ans: Periodic drying disrupts anaerobic soil conditions, limiting methane-producing microbes and significantly lowering greenhouse gas emissions compared to continuously flooded fields.

Q4: How much can farmers earn from methane reduction?

Ans: With about 2.5 tonnes of CO₂-equivalent reduction per hectare, farmers can earn roughly ₹3,300 per hectare per crop through carbon credit markets.

Q5: Who buys carbon credits generated from rice farming?

Ans: Carbon credits are purchased by data centres, airlines, and other energy-intensive industries to offset emissions and meet net-zero carbon targets

Brahmaputra River System, Origin, Length, Tributaries

brahmaputra river system

The Brahmaputra River System is one of Asia's largest and most significant river systems. It originates from the Chemayungdung Glacier, near Mount Kailash, in the Angsi Glacier region in southwestern Tibet. It then passes through Assam and Bangladesh, eventually merging with the Bay of Bengal. 

The river spans across the Indian states of Assam and Arunachal Pradesh and plays a crucial role in the northeastern region of India. The Brahmaputra River rises in the eastern Tibetan Plateau course through India and Bangladesh. The river supports a diverse ecosystem, serving as shelter to a wide range of flora and fauna, including rare and endangered species.

Brahmaputra River System

The Brahmaputra River System is surrounded by the Himalayas to the north, the Patkai Hills to the east, the Assam Hills to the south, and the Himalayas again to the west. The Himalayan regions of Sikkim and Arunachal Pradesh, which form part of the Brahmaputra Basin, experience heavy snowfall. These regions also account for 55.48% of India’s total forest cover, making them some of the greenest areas in the country.

One of the most remarkable features of the Brahmaputra River System is Majuli, an island in Assam, which holds the distinction of being the world’s largest and oldest inhabited river island, recognized by UNESCO. The river system also has a significant hydropower potential of 66,065 MW, making it a crucial resource for renewable energy development.

As the Brahmaputra River flows from Kobo to Dhubri in Assam, it accumulates a large amount of sediment from its 20 tributaries on the north bank and 13 on the south bank. The region receives the majority of its annual rainfall during the South-West monsoon season, with 85% of the total precipitation occurring between May and September.

Brahmaputra River System Origin

The Brahmaputra, meaning "Son of Brahma," originates from the Chemayungdung glacier in southwestern Tibet. Its source lies in proximity to the origins of the Indus and Sutlej rivers. Despite its location at a remarkably high altitude, the Tsangpo River maintains a gentle gradient. It flows at a slow pace, forming a broad river channel that stretches for nearly 640 kilometers.

Brahmaputra River System Map

The Brahmaputra River has its origin in the Chemayungdung Glacier in southwestern Tibet. From there, it flows eastward across the Tibetan Plateau as the Yarlung Tsangpo River. This majestic river later enters India through Arunachal Pradesh, marking the beginning of its long journey across Northeast India. The Brahmaputra River System Map has been shared below.

Brahmaputra River System

Brahmaputra River System Tributaries

The Brahmaputra River System Tributaries play a significant role in shaping its flow and water volume. The rivers in the Himalayan region are primarily glacier-fed, experiencing a rise in water levels during the monsoon season. Heavy rainfall, occurring between May and September due to the southwest monsoon, often leads to flooding in these rivers, impacting the Brahmaputra’s overall flow. The tributaries of the Brahmaputra are classified into two categories: northern (left-bank) tributaries and southern (right-bank) tributaries. These rivers contribute significantly to the river’s strength, often causing seasonal flooding.

Brahmaputra River System Tributaries

Northern (Left-bank) Tributaries

Southern (Right-bank) Tributaries

Lhasa River

Kameng River

Nyang River

Manas River

Parlung Zangbo River

Beki River

Lohit River

Raidak River

Dhanashri River

Jaldhaka River

Kolong River

Teesta River


Subansiri River

Brahmaputra River System Left Tributaries

The Brahmaputra River is fed by several significant tributaries that originate across Tibet, Arunachal Pradesh, and the Northeast Indian region. These rivers not only enrich the water volume of the Brahmaputra but also support hydropower generation, agriculture, flood regulation, and ecological balance. Below is a detailed table including the Brahmaputra River System Left Tributaries, their origins, the states or regions they pass through, and their key contributions to the river system and surrounding ecosystems.

Brahmaputra River System Left Tributaries

Tributary Name

Origin

States/Regions Covered

Key Significance

Lhasa River

Tibet (Lhasa Plateau)

Tibet

Major tributary of Yarlung Tsangpo; contributes to Brahmaputra's upper flow

Nyang River

Nyangtri Prefecture, Tibet

Tibet

Enhances flow in Tibet; important for hydro development

Parlung Zangbo River

Tibet

Tibet

One of the easternmost contributors to the Tsangpo system

Subansiri River

Tibet

Arunachal Pradesh, Assam

Largest tributary; site of major hydropower projects

Kameng River

Tawang, Arunachal Pradesh

Arunachal Pradesh, Assam

Supports agriculture and biodiversity in West Kameng

Lohit River

Eastern Tibet

Arunachal Pradesh, Assam

Joins Siang & Dibang to form Brahmaputra; prone to floods

Dhanashri (Dhansiri)

Laisang Peak, Nagaland

Nagaland, Assam

Important for irrigation; passes through ecologically sensitive zones

Kolong River

Distributary of Brahmaputra

Assam

Supports inland navigation and local livelihoods

Brahmaputra River System Right Tributaries

The Brahmaputra River System is enriched by various tributaries that originate in the Eastern Himalayas and the hills of Northeast India. These tributaries, flowing through diverse terrains and states like Assam, Meghalaya, Sikkim, and even Bhutan and Bangladesh, play an important role in shaping the region’s ecology, economy, and culture. Each river contributes uniquely, be it through hydroelectric potential, biodiversity support, irrigation, or transboundary cooperation. The following table highlights the Brahmaputra River System Right Tributaries detailing their origin, the regions they flow in, and their key significance.

Brahmaputra River System Right Tributaries

Tributary Name

Origin

States/Regions Covered

Key Significance

Manas River

Bhutan Himalayas

Bhutan, Assam

A UNESCO World Heritage Site; supports rich biodiversity and wildlife sanctuaries.

Beki River

Himalayas in Bhutan

Assam

Important for fisheries, floodplain cultivation, and a tributary of the Manas River.

Raidak River

Northern Bhutan

Bhutan, West Bengal, Assam

Supports irrigation and hydropower; merges with the Brahmaputra near Dhubri.

Jaldhaka River

Bitang Lake (Sikkim-Bhutan border)

Sikkim, West Bengal, Bangladesh

Transboundary river; key for farming, hydroelectricity, and cross-border cooperation.

Teesta River

Pauhunri Glacier, Eastern Himalayas

Sikkim, West Bengal, Bangladesh

Major eastern Himalayan river; vital for hydro projects and Indo-Bangladesh water sharing.

Kopili River

Meghalaya Hills (Sapong Reserve)

Meghalaya, Assam

Major source for power and irrigation; joins Brahmaputra near Nagaon.

Kulsi River

Khasi Hills, Meghalaya

Meghalaya, Assam

Seasonal river; known for river dolphins; prone to flooding during monsoon.

Dhansiri (South)

Patkai Hills, Eastern Himalayas

Arunachal Pradesh, Assam

Important for floodplain agriculture and biodiversity; passes through Golaghat.

Krishnai River

West Garo Hills, Meghalaya

Assam

Seasonal river supporting agriculture; joins with Dudhnoi before meeting Brahmaputra.

Dudhnoi River

East Garo Hills, Meghalaya

Assam

Converges with Krishnai River; crucial for local irrigation systems.

Jinjiram River

East Garo Hills, Meghalaya

Meghalaya, Assam

Seasonal waterway; significant for flood management in the Goalpara district.

Sonkosh (Sankosh)

Bhutan

Bhutan, Assam

Borders Assam and West Bengal; joins Brahmaputra near Srirampur; irrigation support.

States Through Which the Brahmaputra River Flows

The majestic Brahmaputra River, one of the longest and most important rivers in India, flows through several northeastern states before entering Bangladesh. In India, the Brahmaputra River passes through the states of Arunachal Pradesh, Assam, Meghalaya, Nagaland, West Bengal, and Sikkim. Originating from the Angsi Glacier in Tibet (where it is known as the Yarlung Tsangpo), the river enters India through Arunachal Pradesh as the Siang or Dihang River, flows majestically across Assam, and finally travels toward West Bengal before entering Bangladesh as the Jamuna River.

Cities Located on the Brahmaputra River

The Brahmaputra River flows through several important cities that play a key role in the cultural, economic, and geographical landscape of Northeast India. Major cities situated along the banks of the Brahmaputra River include Pasighat, Dibrugarh, Tezpur, Guwahati, and Goalpara.

  • Pasighat (Arunachal Pradesh): One of the oldest towns in Arunachal Pradesh, Pasighat lies near the entry point of the Brahmaputra into India and is known for its scenic beauty.
  • Dibrugarh (Assam): Often called the "Tea City of India," Dibrugarh is a major commercial hub located on the banks of the Brahmaputra.
  • Tezpur (Assam): A historical and cultural city, Tezpur sits gracefully along the river, surrounded by lush landscapes.
  • Guwahati (Assam): The largest city in Assam, Guwahati is an important river port and urban center along the Brahmaputra.
  • Goalpara (Assam): Located in Lower Assam, Goalpara is another significant town positioned along the river’s fertile plains.

Brahmaputra River System List of Dams and Hydro Projects

Brahmaputra River System has its vast network of tributaries, it sustains diverse ecosystems and human settlements, contributing significantly to agriculture, culture, and the economy. Below in the table includes the Brahmaputra River System List of Dams and Hydro Projects:

Brahmaputra River System List of Dams and Hydro Projects

Dam

Location

Status

Zangmu Dam

Tibet, China

Operational

Jiacha Dam

Tibet, China

Under construction

Dagu Dam

Tibet, China

Proposed

Jiexu Dam

Tibet, China

Proposed

Upper Subansiri Hydroelectric Project

India

Under construction

Lower Subansiri Hydroelectric Project

India

Under construction

Teesta-V (NHPC) Dam

India

Completed

Teesta-III Dam

India

Under construction

Rangit Dam

India

Completed

Jaldhaka Hydroelectric Project

India and Bhutan

Operational

Kurichu Hydroelectric Project

Bhutan

Operational

Chukha Hydroelectric Project

Bhutan

Operational

Tala Hydroelectric Project

Bhutan

Operational

Daguchu Hydroelectric Project

Bhutan

Operational

Different Names of Brahmaputra River

The Brahmaputra River is known by different names across its journey through various regions, reflecting diverse linguistic and cultural identities. Originating from Tibet, where it is revered as Tsangpo meaning "The Purifier," the river flows through China, India, and Bangladesh. In each of these regions, it adopts unique names.

Different Names of Brahmaputra River

Region

Name

Tibet

Tsangpo (meaning ‘The Purifier’)

China

Yarlung Zangbo, Jiangin

Assam Valley

Dihang or Siang, South of Sadiya: Brahmaputra

Bangladesh

Jamuna River

Padma River: Combined Waters of Ganga and Brahmaputra

Meghana: From the confluence of Padma and Meghna 

Also Check Other River System
Godavari River System Tapti River System
Kaveri River System Mahanadi River System
Ganga River System Narmada River System
Yamuna River System Krishna River System
Indus River System
Brahmaputra River System

Brahmaputra River System FAQs

Q1: What is the river system of Brahmaputra?

Ans: The river originates from the Kailash ranges of Himalayas at an elevation of 5300 M.

Q2: What are the four names of Brahmaputra River?

Ans: Brahmaputra or Luit in Assamese, Yarlung Tsangpo in Tibetan, the Siang/Dihang River in Arunachali, and Jamuna River in Bengali.

Q3: Which glacier is the origin of the Brahmaputra River?

Ans: The Brahmaputra River originates from the Chemayungdung Glacier.

Q4: What is Brahmaputra called in China?

Ans: Tsangpo, the Brahmaputra is also known by its Chinese name.

Q5: Why is Brahmaputra called the red river?

Ans: The soil of this region is naturally rich in iron content, bringing the colour red to the river with a high concentration of red and yellow soil sediments.

Manganese Ore Distribution in India, Map, State Wise Distribution

Manganese Ore Distribution in India

Manganese Ore Distribution in India plays a crucial role in the mineral economy of India. There are substantial manganese resources in India which are primarily associated with Pre Cambrian Rock systems such as the Dharwar and Kuddapa series. The Manganese Ore is used for steel production, alloy manufacturing and several chemical industries which makes it a strategic mineral for industrial growth and infrastructure development across the country.

Manganese Ore Distribution in India

Manganese Ore Distribution in India shows a clear regional concentration pattern shaped by geological history and metallogenic processes. India holds the world’s second largest manganese reserves after Zimbabwe; and ranks as the fifth largest global producer with increased production by 11.8% to 3.8 million metric tonnes in the FY 2024-25. Major deposits of the ore occur in central and eastern regions of India, especially in states such as Odisha, Madhya Pradesh, Maharashtra, Karnataka and Andhra Pradesh. 

For the ease of understanding refer to the Map for Manganese Ore Distribution in India given below:

[my_image src="https://vajiramandravi.com/current-affairs/wp-content/uploads/2026/01/Manganese-Ore-Distribution-in-India-Map.webp" size="full" align="none" width="auto" height="611px" alt="Manganese Ore Distribution in India map" title="Manganese Ore Distribution in India, Map"]

Manganese Ores

Manganese Ores occur in several mineralogical forms, each varying in manganese content and industrial suitability.

  1. Pyrolusite (MnO₂): The most important manganese ore, containing about 63.2% manganese, widely used in steel making and dry cell batteries.
  2. Psilomelane: A hydrated manganese oxide with 45% to 60% manganese, containing impurities of barium, potassium, and sodium, used mainly in alloy production.
  3. Manganite (Mn₂O₃·H₂O): Contains about 62.4% manganese and occurs as crystalline aggregates associated with iron ores.
  4. Braunite: A silicate rich manganese ore containing around 62% manganese and about 10% silica, found in metamorphosed sedimentary deposits.
  5. Association with Iron and Laterite: Manganese is rarely found free and usually occurs alongside iron ore, laterite, and other oxide minerals.

Also Read: Iron Ore

Manganese Ore Distribution in India State Wise

Manganese ore distribution in India shows strong state wise variation based on geological belts and mining history. The contribution in production of Manganese Ores state wise data as per the FY 2019-20 reports has been given here:

[my_image src="https://vajiramandravi.com/current-affairs/wp-content/uploads/2026/01/Manganese-Ore-Distribution-in-India-State-Wise.webp" size="full" align="none" width="auto" height="359px" alt="Manganese Ore Distribution in India State Wise" title="Manganese Ore Distribution in India State Wise"]

  1. Odisha: Holds about 18.5% of India’s total manganese reserves, mainly in Sundargarh, Keonjhar, Kalahandi, and Koraput districts.
  2. Karnataka: Accounts for around 11.5% of national reserves, with major deposits in Uttara Kannada, Ballari, Chitradurga, Shimoga, and Tumakuru districts.
  3. Madhya Pradesh: Contributes nearly 33% of total reserves, with major mining belts in Balaghat and Chhindwara districts.
  4. Maharashtra: Possesses about 24.8% of reserves, concentrated in Nagpur and Bhandara districts, with high grade ores in Ratnagiri.
  5. Andhra Pradesh: Holds about 11.4% of reserves, mainly in Srikakulam and Visakhapatnam districts, with mining history dating back to 1892.
  6. Other States: Rajasthan, Gujarat, Telangana, Goa, Jharkhand and West Bengal together account for the remaining 0.78% of manganese resources.

Manganese Ore Significance

Manganese ore plays a vital role in industrial production, strategic manufacturing, and economic development.

  • Steel Industry Backbone: About 6 kilograms of manganese ore are required to produce one tonne of steel, making it essential for deoxidation and desulfurisation.
  • Alloy Manufacturing: Used in producing ferromanganese and spiegeleisen alloys that enhance steel strength, hardness, and wear resistance.
  • Chemical Industry Use: Manganese compounds are used in bleaching powder, insecticides, fungicides, and glass decolourisation processes.
  • Battery Production: Pyrolusite is a key raw material for dry cell batteries used in electronics and energy storage.
  • Pigments and Paints: Manganese oxides act as black-brown pigments in paints and ceramics.
  • Railways and Defence: High manganese steel is used in railway tracks, rifle barrels, prison bars, and heavy duty safes.
  • Domestic Consumption Pattern: Nearly 4/5 of Manganese Production in India is consumed domestically due to expanding steel demand.
  • Export Trends: Exports have declined over time, with Japan being the largest importer, followed by the USA, Germany, France, and the UK.
  • Global Supply Context: About 70% of world manganese production is controlled by South Africa, Australia, China, and Gabon.
  • Future Demand Outlook: Global manganese demand closely tracks steel production and is expected to rise with infrastructure expansion and industrial growth.

Also Read: Water Resources in India

Manganese Ore Distribution in India Export

Manganese Ore Export in India plays a limited but strategic role. It is influenced by rising domestic steel demand, resource conservation priorities and changing global market conditions.

  • Domestic Consumption Priority: Majority of India’s manganese ore production is used within the country, mainly by steel and alloy industries.
  • Major Importing Countries: Japan remains the largest buyer of Indian manganese ore, followed by the United States, United Kingdom, Germany, France, and Norway.
  • Quality Based Exports: India primarily exports high grade manganese ore, while lower grades are reserved for domestic beneficiation and alloy production.
  • Policy Influence: Export volumes are influenced by government regulations aimed at ensuring long term availability of manganese for domestic industrial needs.

Manganese Ore Distribution in India FAQs

Q1: Which state has the largest Manganese Ore Reserves in India?

Ans: Odisha holds the largest share, accounting for about 44% of India’s total manganese ore reserves and resources.

Q2: Which are the major Manganese Ore Producing States in India?

Ans: Madhya Pradesh, Maharashtra, Odisha, Karnataka, and Andhra Pradesh are the leading manganese producing states in India.

Q3: In which geological formations is Manganese found in India?

Ans: Indian manganese deposits mainly occur in the Dharwar and Kuddapa groups of the Precambrian era.

Q4: Which state is the largest Manganese Ore Producer in India?

Ans: Madhya Pradesh is the largest producer, contributing around one third of India’s total Manganese Ore Production.

Q5: What is the most important Manganese Ore found in India?

Ans: Pyrolusite is the most important and commercially significant manganese ore found across Indian deposits.

Daily Editorial Analysis 3 January 2026

Daily Editorial Analysis

Transforming a Waste-Ridden Urban India

Context

  • Global climate discourse has increasingly recognised waste at the centre of climate action.
  • This was clearly reflected at COP30 in Belém, Brazil, where waste reduction and circularity were highlighted as key strategies for emissions mitigation, inclusive growth, and public health improvement.
  • Initiatives such as the No Organic Waste programme and renewed emphasis on circularity reinforced the idea that waste management is integral to climate solutions.
  • For India, with its rapidly expanding urban landscape, this approach is particularly relevant.

Urbanisation and the Escalating Waste Crisis

  • Urban growth in India is inevitable, but its quality is a matter of choice.
  • Cities increasingly face a stark divide between clean, liveable environments and polluted, waste-choked urban spaces.
  • Many Indian cities fail to meet global standards for environmental health, with air and waste pollution becoming persistent concerns.
  • Despite regulatory action and judicial intervention, improvements have been limited, intensifying public dissatisfaction.
  • The projected scale of waste generation is alarming. By 2030, Indian cities are expected to generate 165 million tonnes of waste annually, rising to 436 million tonnes by 2050 as the urban population approaches 814 million.
  • These trends threaten public health, economic productivity, and climate stability. Achieving garbage-free cities by 2026 is therefore an existential necessity for Indian cities, not a cosmetic aspiration.

Circular Economy as a Strategic Solution

  • The success of the Swachh Bharat Mission in eliminating open defecation demonstrated India’s capacity for large-scale behavioural and infrastructural change.
  • Under SBM Urban 2.0, about 1,100 cities have been declared free of dumpsites, marking progress but also highlighting the distance yet to be covered.
  • Sustainable, garbage-free urban environments are possible only when all cities adopt the circular economy model, which treats waste as a resource.
  • Circularity replaces the linear take-make-dispose approach with one that prioritises waste reduction and resource recovery.
  • This aligns with India’s climate commitments and the principles of Mission LiFE, which emphasise responsible consumption.
  • Circularity thus becomes both an environmental strategy and an economic opportunity.

Managing Organic, Plastic, and Construction Waste

  • India has a structural advantage in that over half of its municipal waste is organic.
  • This can be effectively managed through composting and bio-methanation, including compressed biogas plants that generate green fuel and electricity.
  • Such solutions directly reduce emissions while creating energy value.
  • Dry waste, however, presents greater complexity. Plastics pose serious threats to ecosystems and human health and remain difficult to manage.
  • Effective recycling depends on efficient segregation at source, supported by material recovery facilities that must expand alongside growing waste volumes.
  • Refuse-derived fuel for industries like cement shows promise, but entrepreneurship and market linkages remain underdeveloped.
  • Construction and demolition waste, estimated at 12 million tonnes annually, significantly degrades urban environments.
  • Illegal dumping along roadsides and open spaces is widespread.
  • While much of this waste can be recycled into cost-effective construction materials, inadequate segregation and insufficient recycling capacity limit outcomes. Stronger enforcement of existing and upcoming regulations is essential.

Wastewater, Governance, and Systemic Barriers

  • Circularity also extends to wastewater and faecal sludge management. With freshwater availability increasingly constrained, recycling and reuse for agriculture, horticulture, and industrial purposes are critical.
  • Urban programmes have recognised this link, but effective implementation depends on proactive state-level action.
  • Multiple systemic barriers hinder progress. Waste segregation, collection logistics, processing efficiency, and market viability for recycled products remain inconsistent.
  • Extended Producer Responsibility does not yet cover all waste streams, while construction waste tracking and accountability are weak.
  • Municipalities also face financial constraints, underscoring the need for better coordination, monitoring, and incentive mechanisms.

The Role of Citizens and Markets

  • Circularity cannot succeed without citizen participation. Yet in a rapidly consumerist society, reducing and reusing materials is increasingly challenging.
  • Constant product innovation and lifestyle changes weaken reuse practices.
  • In this context, recycling as practical pillar of circularity is the most achievable near-term strategy, supported by technology, private enterprise, and coherent policy frameworks.
  • Collaborative initiatives such as the Cities Coalition for Circularity reflect growing recognition of the need for shared knowledge and regional cooperation to scale solutions effectively.

Conclusion

  • India’s urban waste challenge lies at the intersection of climate action, public health, and economic development.
  • Circularity offers a viable pathway to transform cities from centres of waste accumulation into systems of resource efficiency.
  • While challenges remain significant, coordinated governance, technological innovation, market development, and informed citizen engagement can drive this transition.
  • In doing so, circularity can become a cornerstone of India’s sustainable urban future.

Transforming a Waste-Ridden Urban India FAQs

 Q1. Why was waste highlighted at COP30?
Ans. Waste was highlighted because reducing and managing it effectively helps cut emissions, improve public health, and support sustainable economic growth.

Q2. Why is achieving garbage-free cities crucial for India?
Ans. Achieving garbage-free cities is crucial because unmanaged waste threatens public health, economic productivity, and climate stability.

Q3. What role does the circular economy play in waste management?
Ans. The circular economy treats waste as a resource and focuses on reducing waste while recovering materials and energy.

Q4. Why is plastic waste particularly challenging to manage?
Ans. Plastic waste is difficult to manage because it harms ecosystems and human health and requires strict segregation and recycling systems.

Q5. Why is citizen participation important for circularity?
Ans. Citizen participation is important because effective waste segregation and responsible consumption begin at the household level.

Source: The Hindu


Recasting Sanitation with Urban-Rural Partnerships

Context

  • The Swachh Bharat Mission (SBM), launched in 2014, has been a transformative public welfare initiative that reshaped India’s rural sanitation landscape.
  • Its central aim was to ensure universal access to toilets, a goal achieved within a decade through the construction of over 12 crore household toilets.
  • As a result, every village in India attained Open Defecation Free (ODF) status. These outcomes significantly improved living conditions, reduced disease burden, and enhanced public health and dignity, particularly for women and vulnerable communities.
  • However, the rapid expansion of sanitation infrastructure also revealed challenges that extend beyond toilet construction.

The Emerging Challenge of Faecal Waste Management

  • With toilets becoming widespread, the management of faecal waste management emerged as a critical concern.
  • In rural areas, septic tanks and pits are commonly used, all of which require periodic desludging.
  • Without organised systems for safe collection, transport, and treatment, untreated waste can contaminate land and water, threatening environmental and health outcomes.
  • These risks underscore the need to move from infrastructure creation to service-based sanitation solutions.

ODF Plus and the Need for Sustainable Sanitation Systems

  • To address these concerns, Swachh Bharat Mission (Grameen) Phase II introduced the concept of ODF Plus, expanding the focus to include solid and liquid waste management, behavioural change, and safe sanitation service chains.
  • By October 2025, nearly 97% of villages achieved ODF Plus status, indicating substantial progress.
  • Yet faecal sludge management remains uneven, particularly in rural and peri-urban regions where treatment capacity is limited.
  • Building sustainable sanitation systems has therefore become essential to preserving earlier gains.

Urban–Rural Partnerships: The Case of Satara

  • Maharashtra has taken a leading role in developing faecal sludge management solutions.
  • The State invested in over 200 faecal sludge treatment plants and encouraged co-treatment in existing sewage treatment plants.
  • In Satara district, an innovative model was implemented by linking four villages to the city’s underutilised treatment plant.
  • Through urban–rural partnerships, villages gained access to safe treatment facilities while cities improved infrastructure utilisation.
  • Gram panchayats engaged private operators to provide scheduled desludging services, funded through modest sanitation taxes, ensuring affordability and accountability.

Decentralised and Cluster-Based Solutions

  • Urban linkages are not feasible for all villages, making decentralised approaches equally important.
  • In Mayani village, regular desludging cycles were introduced and managed by private operators or self-help groups.
  • Additionally, the village was selected for a cluster-level treatment plant designed to serve nearly 80 surrounding villages.
  • Such cluster-level treatment plants demonstrate how rural communities can pool resources to create viable, locally managed sanitation infrastructure.

Collaboration as the Key to Sustainability

  • The experiences from Satara highlight that long-term sanitation success depends on cooperation across administrative and institutional boundaries.
  • Effective faecal sludge management requires coordination between urban and rural governments, public institutions, private service providers, and local communities.
  • Viewing sanitation as a continuous service rather than a one-time construction effort is essential for maintaining outcomes.

Conclusion

  • The Swachh Bharat Mission has fundamentally improved sanitation access across India.
  • Its next phase emphasises the importance of managing waste safely and sustainably to protect health and the environment.
  • Scalable models based on partnerships and decentralised infrastructure offer practical pathways forward.
  • Ultimately, the mission’s success will be defined not by toilets alone, but by resilient systems that uphold sanitation standards for future generations.

Recasting Sanitation with Urban-Rural Partnerships FAQs

 Q1. What was the primary goal of the Swachh Bharat Mission launched in 2014?
Ans. The primary goal was to ensure universal access to household toilets across India.

Q2. Why is faecal sludge management important after achieving ODF status?
Ans. Faecal sludge management is important to prevent environmental contamination and protect public health.

Q3. What does ODF Plus focus on beyond toilet construction?
Ans. ODF Plus focuses on waste management, behavioural change, and sustainable sanitation services.

Q4. How did the Satara model improve rural sanitation?
Ans. The Satara model linked villages to urban treatment plants through scheduled and affordable desludging services.

Q5. Why are cluster-level treatment plants useful in rural areas?
Ans. Cluster-level treatment plants allow multiple villages to share resources for sustainable waste treatment.

Source: The Hindu


Street Dogs, Supreme Court and the Judicial Overreach Debate

Context

  • Over the past decade, the issue of street dogs in India has evolved from a local civic concern into a constitutional and legal controversy, drawing the attention of the Supreme Court of India (SC).
  • The debate lies at the intersection of public safety, animal welfare, judicial overreach, and scientific policy-making, raising important questions about governance, separation of powers, and humane solutions.

Background - Judiciary and the “Dog Problem”

  • The SC, unusually, has taken suo motu cognisance of issues relating to street dogs, even on the basis of unverified media reports.
  • In one instance, without hearing affected parties, the Court directed that all street dogs be confined to dog pounds, a move that would require thousands of crores of rupees and is practically unimplementable.
  • The subject is now under the control of a reconfigured Bench, signifying judicial reconsideration.

Constitutional Concerns - Separation of Powers

  • Separation of powers, part of the Basic Structure Doctrine, mandates that each organ of the State functions within its domain.
  • Under the Prevention of Cruelty to Animals (PCA) Act, 1960, the Animal Welfare Board of India (AWBI) is the designated executive authority to frame guidelines on animal management.
  • The judiciary issuing detailed policy directions risks encroaching into executive functions.
  • The Court could instead direct the AWBI to revise and harmonise guidelines, balancing human safety, and compassion, a Fundamental Duty under Article 51A(g).

Existing Legal Framework - Not a Law Deficit, but an Implementation Deficit

  • The Animal Birth Control (Dogs) Rules, updated in 2023, already provide a clear national protocol Capture–Sterilise–Vaccinate–Release (CSVR).
  • This approach is endorsed by -
    • World Health Organisation (WHO)
    • World Organisation for Animal Health (WOAH)

Why Not Culling or Detention

  • Removal or confinement creates ecological “vacuum zones”, allowing new, unsterilised dogs to migrate in.
  • This restarts the cycle of population growth, aggression, and rabies risk.
  • Therefore, evidence-based policy, rabies control, and One Health approach are better approaches.

Global Best Practices - Lessons for India

  • France

    • Tackled stray dogs through mandatory registration, sterilisation incentives, strict anti-abandonment laws, and improved waste management.
    • Municipal authorities, not courts, led the effort.
    • Result: Sharp decline in stray populations within a decade.
  • Netherlands

    • It became the first country with zero stray dogs, without killing any.
    • This is achieved through nationwide CSVR, strong funding support, public education, penalties for abandonment, and adoption and identification systems.
    • Success is driven by executive coordination and civil society, not judicial activism.
    • Inference: Scientific, humane approaches work better than coercive detention.

Ground Realities in India - The Myth of Dog Pounds

  • Experiences from municipal dog pounds (e.g., Jodhpur) reveal severe neglect, lack of food and medical care, misuse of public funds, and high mortality rates.
  • Dog pounds often function as “death warrants”, not shelters, highlighting governance failure, municipal incapacity and unaccountability.

Behavioural and Social Dimensions

  • Dog aggression is usually linked to hunger, sexual disturbance (lack of neutering), and human provocation (stone-pelting). Fed and sterilised dogs are largely non-aggressive.
  • Street dogs -
    • Act as informal security in many localities.
    • Are cared for by poor and lower-middle-class communities.
    • Help inculcate compassion among children.
    • Are used in therapy and psychological interventions.

Challenges and Way Ahead

  • Poor implementation of existing laws and rules: Strict implementation of ABC/CSVR Rules, 2023.
  • Judicial overreach into executive policymaking: Judicial restraint coupled with executive accountability.
  • Inadequate municipal infrastructure and funding: Strengthening municipal capacities and monitoring mechanisms.
  • Elite-driven perceptions and dog-related phobias: Focus on humane, scientific, and decentralised solutions. Targeted action against genuinely aggressive dogs, not blanket measures.
  • Weak enforcement against pet abandonment: Public education on responsible pet ownership.

Conclusion

  • India’s street-dog issue is not a legal vacuum but a governance and implementation failure.
  • Scientific evidence, global best practices, and constitutional principles all point towards humane, executive-led, and evidence-based solutions, not mass detention or judicial micromanagement.
  • Upholding compassion as a Fundamental Duty, while ensuring public safety, requires rational policymaking grounded in science—not fear, sentimentality, or impractical orders.

Judicial Overreach Debate FAQs

Q1. How does the SC’s intervention in street-dog management raise concerns regarding the doctrine of separation of powers?

Ans. By issuing policy directions on animal management, the judiciary risks encroaching upon executive functions.

Q2. Why is the Capture–Sterilise–Vaccinate–Release (CSVR) model considered the most sustainable solution?

Ans. CSVR is evidence-based, endorsed by WHO and WOAH, and effectively controls population growth and rabies.

Q3. How Article 51A(g) of the Indian Constitution is relevant to the street-dog debate?

Ans. Article 51A(g) mandates compassion towards living creatures, requiring humane and scientific approaches to animal management.

Q4. What lessons can India draw from France and the Netherlands in addressing the street-dog issue?

Ans. Strong municipal leadership, public education, sterilisation, strict enforcement against abandonment, etc.

Q5. Why are dog pounds considered an impractical and inhumane solution?

Ans. Due to poor municipal capacity, neglect, lack of medical care, and high mortality.

Source: IE

Daily Editorial Analysis 3 January 2026 FAQs

Q1: What is editorial analysis?

Ans: Editorial analysis is the critical examination and interpretation of newspaper editorials to extract key insights, arguments, and perspectives relevant to UPSC preparation.

Q2: What is an editorial analyst?

Ans: An editorial analyst is someone who studies and breaks down editorials to highlight their relevance, structure, and usefulness for competitive exams like the UPSC.

Q3: What is an editorial for UPSC?

Ans: For UPSC, an editorial refers to opinion-based articles in reputed newspapers that provide analysis on current affairs, governance, policy, and socio-economic issues.

Q4: What are the sources of UPSC Editorial Analysis?

Ans: Key sources include editorials from The Hindu and Indian Express.

Q5: Can Editorial Analysis help in Mains Answer Writing?

Ans: Yes, editorial analysis enhances content quality, analytical depth, and structure in Mains answer writing.

Export Bottlenecks: States Flag Testing and Logistics Gaps

Export Bottlenecks in India

Export Bottlenecks in India Latest News

  • Beyond high US tariffs, India’s goods exports are being hit by costlier raw materials, a shortage of testing facilities to meet global quality standards, and inadequate availability of shipping containers, the Union Commerce and Industry Ministry said in response to an RTI application.
  • These concerns were raised by exporters at a Board of Trade meeting chaired by Commerce and Industry Minister Piyush Goyal on November 25, 2025.

Board of Trade(BoT)

  • The Board of Trade (BoT) is an advisory body under the Ministry of Commerce & Industry, chaired by the Commerce Minister. 
  • It serves as a key forum for shaping India’s Foreign Trade Policy (FTP) by bringing together the Centre, States, industry, and trade bodies.
  • The Board of Trade acts as a bridge between policy and practice, ensuring that trade policies reflect ground realities and support export growth across regions and sectors.

Composition of the BoT

  • Chair: Minister for Commerce & Industry
  • Members: Government officials, trade experts, and representatives from:
    • Export Promotion Councils
    • Chambers of Commerce and Industry
    • Financial and trade institutions such as SBI, ECGC, and EXIM Bank

Backdrop: US Tariffs and Stalled Trade Talks

  • The BoT meeting took place amid slowing exports, driven by steep US tariffs of 50% and the failure of India and the United States to conclude a trade deal by fall 2025.
  • India had been among the first countries to initiate trade talks after PM Modi visited Washington in February 2025.
  • The tariffs, which came into effect on August 27, 2025, led to order cancellations, delayed payments, and fears of export diversion to competitors such as Bangladesh, Vietnam, and China.

Export Trends and Sectoral Impact

  • Exports declined in October but rose 19% in November, driven by products outside the tariff net.
  • Labour-intensive sectors such as garments and footwear face the risk of losing market share as shipments are increasingly replaced by competitors.
  • Rajasthan reported that US tariffs led to order cancellations in the gems and jewellery sector, along with delayed payments.
  • Spices Board: Flagged a crisis due to a 50% US duty on oleoresin, a key input for flavour and aroma in food products.
  • Pharmaceuticals: Despite generic drugs being excluded, Goa highlighted that pharma exports were still affected by tariffs.
  • Seafood: The Seafood Exporters Association reported a significant drop in exports to the US.

India’s Strategy

  • To offset pressure from the US market, New Delhi is actively pursuing new markets. 
  • In 2025, India signed three free trade agreements with Oman, New Zealand, and the United Kingdom, signalling a push towards export diversification.

Anti-Dumping and Countervailing Duties

  • Beyond tariffs, exporters raised concerns over anti-dumping duties:
    • Gujarat expressed apprehension over export losses due to US anti-dumping actions.
    • Spices Board highlighted issues arising from anti-dumping and Countervailing Duties (CVDs).
  • Although the United States has initiated most anti-dumping investigations against China, it has launched nine probes against Indian industrial exports since July last year, including:
    • Hexamine
    • Oleoresin paprika
      • Oleoresins help manufacturers achieve flavour and aroma in their final products.
    • Certain freight rail couplers
    • Overhead door counterbalance torsion springs

Other Major Bottleneck

  • Assam flagged hurdles in tea exports due to shipping line levies on empty containers, given the state’s landlocked geography.
  • Gujarat also highlighted a shortage of shipping containers, affecting exporters across sectors.

Lack of Testing Facilities

  • Rajasthan noted that export samples are sent to Surat and other states due to the absence of local testing labs.
  • Uttarakhand reported no testing labs, forcing exporters to rely on facilities in Uttar Pradesh.
  • Labour-intensive sectors stressed that inadequate testing capacity leads to delays and higher costs.
  • There is need for more labs accredited by the Marine Products Export Development Authority and National Accreditation Board for Testing and Calibration Laboratories.
    • This is due to insufficient capacity with the Export Inspection Council.

Access to Inputs and High Cost Pressures

  • MSME representatives stated that domestic raw material prices are 15–20% higher than international levels.
  • Textile exporters highlighted energy costs for spinning and manufacturing being 15–20% higher, seeking compensation or relief.

Regulatory and Compliance Burdens

  • Exporters pointed out that Bureau of Indian Standards (BIS) norms are being applied even for exports to the US and EU, despite differing standards—raising compliance complexity and costs.
  • MSMEs flagged difficulties with Quality Control Orders (QCOs), seeking a more facilitatory inspection approach.

Sector-Specific Issues

  • The Gem and Jewellery Export Promotion Council (GJEPC) raised concerns over restrictions on gold, platinum, and silver, seeking an automatic import route where duty benefits are unavailable; restrictions have made component imports costlier.
  • Ceramics industry representatives noted that District Export Committees are not meeting regularly and need better monitoring.

Source: IE | NDTVP

Export Bottlenecks FAQs

Q1: What export bottlenecks were flagged at the Board of Trade meeting?

Ans: Exporters highlighted shortages of testing labs, lack of shipping containers, high raw material costs, and regulatory burdens affecting competitiveness.

Q2: How have US tariffs affected Indian exports?

Ans: Steep US tariffs led to order cancellations, delayed payments, and fears of export diversion to competitors like Bangladesh, Vietnam, and China.

Q3: Why are testing facilities crucial for exporters?

Ans: Testing labs ensure compliance with international quality and safety standards, preventing shipment rejections, delays, and financial losses for exporters.

Q4: Which sectors are most affected by current export challenges?

Ans: Labour-intensive sectors such as garments, footwear, seafood, gems and jewellery, and MSME-driven industries face the greatest impact.

Q5: What steps is India taking to offset export pressures?

Ans: India is diversifying markets by signing FTAs with Oman, New Zealand, and the UK, while reviewing trade facilitation and infrastructure gaps.

Car Nicobar Island

Car Nicobar Island

Car Nicobar Island Latest News

The Chief of Defence Staff recently inaugurated a major runway upgrade at the Indian Air Force’s Car Nicobar air base.

About Car Nicobar Island

  • It is part of the Nicobar district in the Andaman and Nicobar Islands Union Territory.
  • It is the northernmost island of the Nicobar group. 
  • It lies south of Little Andaman and north of Nancowry Island.
  • The ten-degree channel lies on the northern side of the island and separates the Andaman Islands and Nicobar Islands.
  • Despite being a small island – under 127 sq.km. – it holds nearly half of Nicobar’s population (over 17,800 in 2011) and serves as the district headquarters.
  • It is remarkably flat except for some cliffs in the north and small hilly areas in the interior. 
  • It is bordered by a silvery beach and areas of flat ground consisting of coraline diluvium.
  • It is inhabited primarily by the Nicobarese tribal community (Scheduled Tribe).
  • The climate of Car Nicobar Island is a tropical monsoon climate, as it is just 9 degrees from the equator, with an annual rainfall of 400 mm.
  • The Car Nicobar islands do not have any evergreen forests, which dominate the central and southern islands of the Nicobars. 
  • Most of the island is covered with coconut plantations, and natural flora is present only in the interior areas.
  • The island has been designated an Important Bird Area (IBA) by BirdLife International.
  • The island was severely affected by the tsunami that was caused by the 2004 Indian Ocean earthquake, which led to many deaths and damaged infrastructure.
    • Car Nicobar lies 750 km (470 mi) from the epicenter of the 2004 Indian Ocean earthquake, and the ensuing tsunamis struck it with great force.

Source: TOI

Car Nicobar Island FAQs

Q1: Which is the northernmost island of the Nicobar group?

Ans: Car Nicobar Island.

Q2: Which islands lie north and south of Car Nicobar Island?

Ans: Little Andaman lies to the north, and Nancowry Island lies to the south.

Q3: What is the main tribal community inhabiting Car Nicobar?

Ans: It is inhabited primarily by the Nicobarese tribal community.

Q4: What is the general topography of Car Nicobar Island?

Ans: It is remarkably flat, with some cliffs in the north and small hilly interior areas.

Q5: What type of climate does Car Nicobar Island experience?

Ans: A tropical monsoon climate.

Galaxy Frog

Galaxy Frog

Galaxy Frog Latest News

According to the study, a group of seven galaxy frogs vanished, all likely to be dead, after multiple photographers descended on their habitat.

About Galaxy Frog

  • Galaxy frogs (Melanobatrachus indicus) are one of the rarest and most dazzling amphibians in the world.
  • The frog belongs to the family Microhylidae and sub-family Melanobatrachinae.
    • Its dorsal region is warty and speckled with bluish-white spots that resemble stars in the night sky, hence the name 'Galaxy frog'.
  • It has been declared the flagship species of Mathikettan Shola National Park in Idukki , Kerala
  • Appearance: It measures just 2 centimetres-3.5 centimetres and has shiny black skin dotted with pale blue speckles, resembling a clear night sky studded with stars.
  • Habitat: It nestles under logs and stones on the forest floor at elevations above 900 metres.
  • Distribution:  It is endemic to wet evergreen forests of southern Western Ghats in Kerala and Tamil Nadu states of India.
  • Conservation Status: IUCN Red List: Vulnerable 

Characteristics of Galaxy Frog

  • Unlike other frogs, the Galaxy Frog doesn’t have a vocal sac and hence it can’t be identified through its calls.
  • The bright-coloured spots are being inferred to aid the frog in communication.
  • It is a nocturnal species and extremely sensitive to light
  • It absorbs water and oxygen through their skin, so moist air is a must for this species. 
  • They keep their skin moist by secreting a slimy secretion called mucus to breathe through the skin.
  • Threats: Major threats to these creatures are the conversion of forest areas to farm land, firewood collection and landslide and Photo tourism has emerged as a new danger to galaxy frogs.

Source: IE

Galaxy Frog FAQs

Q1: What is the conservation status of the Galaxy Frog?

Ans: Vulnerable

Q2: Where is the Galaxy Frog primarily found?

Ans: Western Ghats

Oil Reserves in India, Formation, Distribution, Map, Govt Initiatives

Oil Reserves in India

Oil Reserves in India play a crucial role in ensuring the country’s energy security, economic stability, and industrial growth. Petroleum oil is the backbone of transportation, manufacturing, power generation, and defence sectors. Despite being one of the largest consumers of crude oil in the world, India has limited domestic oil reserves, making it heavily dependent on imports.

Oil Reserves in India

India has moderate proven oil reserves compared to global standards. These reserves are unevenly distributed and largely confined to specific geological regions. The country’s sedimentary basins cover nearly 3.36 million square kilometres, but only a portion has been explored so far.

Domestic crude oil production meets only 15-18% of India’s total demand, while the rest is fulfilled through imports from West Asia, Russia, and Africa. This makes the development of Oil Reserves in India a strategic priority.

Also Read: Coal Mines In India

Constituents of Petroleum and Mineral Oil

Petroleum, also known as mineral oil, is a complex mixture of hydrocarbons along with small amounts of other organic compounds. It is formed over millions of years from decomposed organic matter under high pressure and temperature in sedimentary rocks.

  • Hydrocarbons (90–95%) – Mainly compounds of hydrogen and carbon, forming alkanes, cycloalkanes, and aromatic hydrocarbons.
  • Organic compounds (5–10%) – Contain oxygen, nitrogen, sulphur, and other elements.
  • Trace organo-metallic compounds – Include metals like vanadium and nickel present in very small amounts.
  • Minor impurities – Influence refining processes and environmental emissions when combusted.

Formation of Petroleum and Mineral Oil

Petroleum or mineral oil is formed over millions of years through geological and biochemical processes in sedimentary rocks. Its formation requires specific conditions of organic matter accumulation, burial, pressure, and temperature.

  • Origin: Derived from the remains of microscopic plants and animals deposited in sediments millions of years ago.
  • Sedimentary Rock Requirement: Only occurs in porous and permeable sedimentary rocks capable of storing oil.
  • Porosity: Rocks must have tiny pores or gaps to accommodate sufficient quantities of oil.
  • Permeability: Pores must be interconnected to allow oil and gas to flow when wells are drilled.
  • Impervious Cap Rock: Porous rocks must be capped by impermeable layers to prevent oil from escaping.
    Accumulation in Traps: Oil generally accumulates in anticlines, fault traps, and other geological traps.
  • Favourable Geological Period: Most petroleum in India formed during the Tertiary period when conditions for organic deposition were ideal.
  • Transformation Process: Buried organic matter undergoes heat and pressure, converting it into hydrocarbons over millions of years.

Distribution of Petroleum and Mineral Oil in India

The Distribution of Petroleum and Mineral Oil in India is closely linked to sedimentary basins formed over millions of years. These basins contain organic matter that, under heat and pressure, transformed into hydrocarbons.

1. Assam (Brahmaputra Valley)

Assam is the oldest oil-producing region in India and holds a historic position in the country’s petroleum industry. Oil-bearing strata extend for nearly 320 km along the Brahmaputra Valley in Upper Assam. The oil occurs in Tertiary sedimentary rocks associated with anticlines and fault traps.

  • Oldest oil-producing state in India
  • Major oilfields: Digboi, Naharkatiya, Moran-Hugrijan
  • Digboi is the oldest oilfield in India
  • Oil is refined mainly at Digboi, Guwahati, Bongaigaon, and Barauni
  • Oilfields are relatively inaccessible and far from major consumption centres

2. Gujarat (Cambay Basin)

Gujarat is one of the most important on-shore oil-producing regions in western India. The oilfields are mainly located in the Cambay (Khambhat) Basin, which contains thick sedimentary deposits rich in hydrocarbons.

  • Major oilfields: Ankleshwar, Kalol, Mehsana, Nawgam, Kosamba, Kathana, Barkol, Sanand
  • Ankleshwar is the most productive oilfield of the state
  • Oil is transported to refineries at Trombay and Koyali
  • Well-developed pipeline network supports production and refining

3. Rajasthan (Barmer–Sanchor Basin)

Rajasthan has emerged as India’s largest on-shore oil-producing state due to major discoveries in the Barmer region. The basin contains significant reserves trapped in sandstone formations.

  • One of the largest inland oil discoveries in India
  • Major oilfields: Mangala, Saraswati, Rajeshwari
  • Contributes significantly to India’s domestic crude oil output
  • Modern extraction technology used for enhanced oil recovery

4. Mumbai High (Western Offshore Region)

Mumbai High is the largest and most productive oil-producing region in India. It is an off-shore oilfield located in the Arabian Sea, about 160 km west of Mumbai. Discovered in 1974, it lies in Miocene-age rock strata.

  • Largest contributor to India’s crude oil production
  • Located in the western off-shore basin
  • Supported by advanced offshore drilling platforms like Sagar Samrat
  • Includes nearby fields such as Bassein

5. Krishna–Godavari Basin (Eastern Offshore Region)

The Krishna–Godavari (KG) Basin along the eastern coast is an important emerging oil and gas-producing region. It holds substantial hydrocarbon potential in both on-shore and off-shore areas.

  • Located off the coast of Andhra Pradesh
  • Important off-shore oilfield: Rava
  • Significant reserves of both oil and natural gas
  • Considered one of India’s most promising future energy regions

6. Cauvery Basin (Tamil Nadu and Offshore Areas)

The Cauvery Basin is another important oil-producing region located in Tamil Nadu and adjoining offshore areas. The basin has both on-shore and off-shore oilfields.

  • Important oilfields: Narimanam, Kovilappal
  • Oil found in Tertiary sedimentary formations
  • Moderate but steady contribution to domestic production

Also Read: Silver Production in India

Oil Reserves in India Map

An Oil Reserves in India Map highlights the concentration of petroleum resources along the western coast and north-eastern region. Offshore areas dominate India’s oil production, while onshore reserves are relatively scattered.

[my_image src="https://vajiramandravi.com/current-affairs/wp-content/uploads/2026/01/Oil-Reserves-in-India-map.webp" size="full" align="none" width="auto" height="640px" alt="Oil Reserves in India map" title="Oil Reserves in India map"]

India’s Oil Reserves vs Global Oil Reserves

India’s oil reserves are very limited compared to global oil-rich nations, even though India is among the top crude oil consumers worldwide. While India holds less than 1% of global proven oil reserves, countries in the Middle East and Russia dominate global reserves, making India highly dependent on imports.

India’s Oil Reserves vs Global Oil Reserves
India Global Oil Reserves

Less than 1% share of proven oil reserves

Over 50% reserves concentrated in the Middle East

Domestic production meets only a small part of demand

Many countries have surplus production

Heavy import dependence (over 80%)

Major exporters of crude oil

Oilfields mainly in Mumbai High, Assam, Gujarat, Rajasthan

Large reserves in Saudi Arabia, Venezuela, Russia, Iran

Low reserve-to-production ratio

High reserve-to-production ratio

Vulnerable to global price and supply shocks

Greater energy and strategic stability

Government Initiatives for Oil Exploration

Government Initiatives for Oil Exploration in India are aimed at boosting domestic crude oil production, reducing import dependence, and encouraging private and foreign investment. These reforms focus on policy simplification, flexible licensing, and faster monetisation of oil and gas resources.

  • Hydrocarbon Exploration and Licensing Policy (HELP): Introduced a single licence for all hydrocarbons, replaced profit-sharing with a revenue-sharing model, and provided pricing and marketing freedom to explorers.
  • Open Acreage Licensing Policy (OALP): Allows companies to choose exploration blocks of interest through continuous bidding rounds, promoting exploration of unexplored and frontier areas.
  • New Exploration Licensing Policy (NELP): Earlier framework that opened the sector to private and foreign players, later replaced due to regulatory rigidity and delays.
  • Discovered Small Field Policy (DSF): Aimed at monetising small and marginal oilfields quickly by encouraging participation of smaller operators.
  • National Data Repository (NDR): Provides easy access to geological and geophysical data, improving transparency and informed investment decisions.

Environmental Concerns Related to Oil Exploration

Environmental concerns related to oil exploration arise due to the intensive drilling, extraction, and transportation activities involved in the petroleum sector. These activities often take place in ecologically sensitive areas such as coastal regions, forests, wetlands, and offshore zones, posing serious risks to the environment.

  • Oil spills and leakages that contaminate marine and coastal ecosystems, affecting fisheries and coral reefs
  • Air pollution caused by gas flaring, drilling operations, and emissions of greenhouse gases
  • Water pollution due to contamination of surface and groundwater from drilling muds and chemical waste
  • Land degradation and deforestation during on-shore exploration and pipeline construction
  • Loss of biodiversity and disturbance to wildlife habitats, especially in sensitive regions
  • Climate change impacts due to increased carbon emissions from fossil fuel extraction and use

Also Read: Manganese Ore Distribution in India

Challenges in Enhancing Domestic Oil Production

  • Limited proven reserves: India holds less than 1% of global proven crude oil reserves, which restricts large-scale expansion of domestic output.
  • High import dependence: Domestic production meets only 15–18% of India’s crude oil demand, making the country heavily reliant on imports.
  • Declining production from mature fields: Major fields such as Mumbai High and Assam have crossed peak production, leading to falling output despite enhanced recovery efforts.
  • High cost of offshore and deep-water exploration: Deep-sea drilling involves advanced technology and high capital investment, increasing financial risk for operators.
  • Technological constraints: Limited access to advanced technologies for enhanced oil recovery (EOR) and exploration of ultra-deep and unconventional resources.
  • Low exploration coverage: Out of India’s 26 sedimentary basins, several frontier and deep-water basins remain underexplored.
  • Long gestation period: Oil exploration projects take 10-15 years from exploration to commercial production, delaying output gains.
  • Regulatory and environmental hurdles: Multiple clearances and strict environmental norms often slow project execution.

Way Forward

  • Accelerate exploration in unexplored and frontier basins, especially deep-water and offshore regions
  • Adopt advanced technologies such as enhanced oil recovery (EOR), seismic imaging, and digital oilfields
  • Improve recovery from mature fields through secondary and tertiary recovery techniques
  • Simplify regulatory and clearance processes to reduce project delays
  • Encourage private and foreign investment by ensuring policy stability and risk-sharing mechanisms
  • Expand Strategic Petroleum Reserves (SPR) to cushion against global supply disruptions
  • Strengthen overseas oil asset acquisitions to secure long-term crude supplies
  • Promote energy efficiency and conservation to moderate demand growth
  • Accelerate transition to renewable and alternative energy sources to reduce long-term oil dependence

Oil Reserves in India FAQs

Q1: Where are oil reserves mainly found in India?

Ans: Oil reserves in India are mainly found in Mumbai High (offshore), Assam, Gujarat, and Rajasthan, along with emerging reserves in the Krishna–Godavari and Cauvery basins.

Q2: Which is the largest oil-producing region in India?

Ans: Mumbai High, located in the Arabian Sea off the western coast, is the largest and most productive oil-producing region in India.

Q3: Which state is the largest on-shore oil producer in India?

Ans: Rajasthan is currently the largest on-shore oil-producing state due to major discoveries in the Barmer basin.

Q4: Why does India import most of its crude oil?

Ans: India imports most of its crude oil because domestic production meets only about 15–18% of total demand, while consumption continues to rise rapidly.

Q5: How many sedimentary basins does India have?

Ans: India has 26 sedimentary basins, covering both on-shore and off-shore areas with hydrocarbon potential.

Enquire Now