Top 10 Air Defence Systems in the World, List, Range, Uses

Top 10 Air Defence Systems In The World

The Top 10 Air Defence Systems in the World reflect a strategic shift toward layered, networked, and high-speed interception capabilities. Modern warfare is increasingly dominated by aerial threats such as ballistic missiles, hypersonic glide vehicles, armed drones, and stealth aircraft. To counter these threats, nations rely on advanced air defence systems that integrate radars, interceptor missiles, command-and-control networks, and real-time surveillance. With rising geopolitical conflicts and missile proliferation, air defence systems now play a crucial role in protecting airspace, strategic assets, and civilian infrastructure worldwide.

Air Defence Systems

Air defence systems are military technologies designed to detect, track, intercept, and destroy hostile aerial objects including aircraft, cruise missiles, ballistic missiles, and unmanned aerial vehicles. These systems combine long-range surveillance radars, fire control radars, interceptor missiles, and battle management systems into Integrated Air Defence Systems (IADS). As per global defence market estimates, the air defence systems market was valued at USD 46.55 billion in 2024 and is projected to reach USD 81.92 billion by 2035 (market projected to grow at a CAGR of 5.27% between 2025 and 2035), driven by hypersonic threats, drone warfare, and missile modernisation.

Top 10 Air Defence Systems in the World List

The Top 10 Air Defence Systems in the World are ranked based on operational range, interception altitude, target spectrum, combat performance, and technological sophistication.

  1. S-500 Prometheus- Russia
  2. S-400 Triumph- Russia
  3. THAAD- United States
  4. David’s Sling- Israel/USA
  5. Patriot PAC-3- United States
  6. S-300VM/ Antey-2500- Russia
  7. Aster 30 SAMP/T- France/ Italy
  8. HQ-9- China
  9. Barak-8- India/Israel
  10. Iron Dome- Israel

1. S-500 Prometheus

The S-500 Prometheus is Russia’s most advanced strategic air and missile defence system, designed for next-generation warfare.

  • Maximum interception range of up to 600 km for ballistic targets and 500 km for aerial targets
  • Capable of intercepting targets at altitudes up to 180-200 km, including low Earth orbit threats
  • Interceptor missile speed reaches Mach 20, enabling hypersonic interception
  • Can simultaneously engage 10 hypersonic targets travelling at 7 km per second
  • Designed to counter ballistic missiles, hypersonic weapons, UAVs, and satellites

2. S-400 Triumph

The S-400 Triumph is a long-range, multi-target air defence system widely deployed globally.

  • Maximum engagement range of 400 km with altitude coverage of 30-56 km
  • Tracks and engages up to 36 targets simultaneously
  • Uses multiple interceptor missiles including 40N6, 48N6, and 9M96 variants
  • Effective against aircraft, cruise missiles, ballistic missiles, and UAVs
  • Operational in Russia, India, China, Turkey, and other countries

3. THAAD (Terminal High Altitude Area Defense)

THAAD is a high-altitude ballistic missile defence system developed by the United States.

  • Engagement range of approximately 200 km
  • Interception altitude up to 150 km, enabling exo-atmospheric kills
  • Uses hit-to-kill kinetic interceptors without explosives
  • Interceptor speed exceeds Mach 8
  • Deployed in South Korea, UAE, and integrated with Patriot and Aegis systems

4. David’s Sling

David’s Sling is a medium-to-long range missile defence system jointly developed by Israel and the United States.

  • Effective range up to 300 km
  • Designed to intercept tactical ballistic missiles, cruise missiles, drones, and aircraft
  • Uses Stunner interceptor missile with dual seeker technology
  • Interceptor speed exceeds Mach 7
  • Forms a key layer between Iron Dome and Arrow systems in Israel’s defence architecture

5. Patriot PAC-3

Patriot PAC-3 is a combat-proven air and missile defence system manufactured by Raytheon.

  • Engagement range of 160-170 km
  • Effective interception altitude up to 24 km
  • PAC-3 variant uses hit-to-kill technology
  • Widely deployed in over 17 countries, including Japan, Germany, Saudi Arabia
  • Integrated into multi-layered missile defence networks alongside THAAD

6. S-300VM/ Antey-2500

The S-300VM is a mobile long-range air and missile defence system developed by Russia.

  • Maximum engagement range of 250 km
  • Effective interception altitude up to 30 km
  • Capable of engaging aircraft, cruise missiles, and intermediate-range ballistic missiles
  • Interceptor missile speed exceeds Mach 7
  • Deployed in countries such as Egypt and Venezuela

7. Aster 30 SAMP/T

Aster 30 SAMP/T is a European air defence system developed jointly by France and Italy.

  • Operational range between 120-150 km
  • Interception altitude up to 25 km
  • Uses Aster 30 missile with active radar homing
  • Capable of engaging short-range ballistic missiles and cruise missiles
  • Deployed by France, Italy, and Singapore

8. HQ-9

HQ-9 is China’s long-range surface-to-air missile system.

  • Maximum engagement range of 200 km
  • Effective altitude of approximately 27 km
  • Incorporates phased-array radar technology
  • Designed to counter aircraft, cruise missiles, and ballistic missiles
  • Advanced variants include HQ-9B and HQ-9C

9. Barak-8

Barak-8 is a joint India-Israel air defence system designed for land and naval operations.

  • Engagement range of 70-100 km
  • Interception altitude up to 20 km
  • Uses active radar seeker missiles
  • Effective against aircraft, UAVs, cruise missiles, and anti-ship missiles
  • Deployed by Indian Navy, Indian Air Force, and Israeli Defence Forces

10. Iron Dome

Iron Dome is a short-range air defence system developed by Israel for rocket interception.

  • Effective range up to 70 km
  • Interception altitude around 10 km
  • Uses Tamir interceptor missiles
  • Achieved a combat success rate of over 90%
  • Designed to neutralise rockets, artillery shells, and mortars in real time

Top 10 Air Defence Systems in the World FAQs

Q1: What are Top 10 Air Defence Systems in the World used for?

Ans: Air defence systems detect, track, and destroy hostile aircraft, missiles, drones, and rockets to protect national airspace and critical assets.

Q2: Which is the most advanced among Top 10 Air Defence Systems in the World?

Ans: The S-500 Prometheus of Russia is considered the most advanced due to its hypersonic interception and satellite-targeting capability.

Q3: Which has the highest combat success rate among Top 10 Air Defence Systems in the World?

Ans: Israel’s Iron Dome has achieved a combat interception success rate of over 90 percent against rockets and artillery shells.

Q4: Which air defence system is jointly developed by India and Israel?

Ans: Barak-8 is jointly developed by India and Israel for land and naval air defence against aircraft and missile threats.

Q5: Why are air defence systems gaining global importance?

Ans: Rising use of ballistic missiles, drones, and hypersonic weapons has made air defence systems critical for modern national security.

Parts of Indian Constitution, Check All 25 Parts Subject, Key Details

Parts of Indian Constitution

The Constitution of India, adopted in 1950, originally consisted of 395 Articles, 22 Parts, and 8 Schedules. Over time, through amendments, its scope has expanded to address emerging needs of governance and society. Today, the Constitution contains 448 Articles, 25 Parts, and 12 Schedules.

The Parts of Indian Constitution serve as the backbone, organizing its provisions into broad themes such as fundamental rights, directive principles, governance structure, and emergency provisions. Later additions like Part IXA (Municipalities), Part IXB (Co-operative Societies), and Part XIVA (Tribunals) highlight the evolving nature of constitutional law in India.

It’s also important to note that when new Articles or Parts are inserted, they are numbered alphabetically (like Article 21A) to maintain the document’s structure without disrupting the original sequence.

Parts of Indian Constitution 

The Constitution of India is not just a legal document but also the supreme law of the land. It lays down the framework of governance by defining the roles of people in positions of authority and clearly outlining the limitations on their power. At the same time, it secures the rights, powers, procedures, and duties of both the government and the citizens.

What makes it unique is its emphasis on the supremacy of the Constitution itself, rather than the supremacy of the legislature. This ensures that every law and every action of the government remains within the constitutional framework.

To understand this structure better, here’s an overview of the Parts of the Indian Constitution presented in a table:

Parts of Indian Constitution Overview

Particulars

Details

Constitution formed on

26th November 1949

Parts of Indian Constitution Originally

22 Parts

Parts of Indian Constitution at Present

25 Parts

New Parts added in Constitution

  • Part IX A of the Constitution was inserted by the Constitution (74th Amendment) Act, 1992. It contains provisions for local self government at the urban level.
  • Part IXB of the Constitution grants constitutional status to co-operative societies and contains provisions for their democratic functioning. It was inserted by the Constitution (97th, Amendment) Act, 2011.
  • Part XIVA of the Indian Constitution provides for the appointment of tribunals for administrative and other disputes. It was not a part of the Constitution of India 1950, but was added by the Constitution (Forty-second Amendment) Act, 1942.

List of Parts of Indian Constitution

The Indian Constitution is a written document that serves as the supreme law of the land. It was drafted by the Constituent Assembly, with key contributions from leaders like Dr. B.R. Ambedkar, Rajendra Prasad, and Jawaharlal Nehru, and came into effect on January 26, 1950.

To ensure clarity and proper governance, the Constitution is divided into distinct sections that address specific subjects. Over time, it has expanded and now consists of 25 Parts, each focusing on different aspects of governance, rights, and duties.

List of Parts of Indian Constitution

Parts and Subject

Articles

Part I - The Union and its Territories

1 - 4

Part II - Citizenship

5 -11

Part III - Fundamental Rights

12 - 35

Part IV - Directive Principles of State Policy

36 - 51

Part IV A - Fundamental Duties

51A

Part V - The Union

52 - 151

Part VI - The States

152 - 237

Part VII - The States in Part B of First Schedule

238 [Repealed]

Part VIII - The Union Territories

239 - 242

Part IX - The Panchayats

243 - 243O

Part IXA - The Municipalities

243P - 243ZG

Part IXB - The Co-operative Societies

243ZH - 243ZT

Part X - The Scheduled and Tribal Areas

244 - 244A

Part XI - Relation between the Union and the States

245 - 263

Part XII - Finance, Property, Contracts and Suits

264 - 300A

Part XIII - Trade, Commerce and Intercourse within the territory of India

301 - 307

Part XIV - Services Under the Union and the States

308 - 323

Part XIVA - Tribunals

323A - 323B

Part XV - Elections

324 - 329A

Part XVI - Special provisions relating to certain classes

330 - 342

Part XVII - Official language

343 - 351

Part XVIII - Emergency Provisions

352 - 360

Part XIX - Miscellaneous

361 - 367

Part XX - Amendment of the Constitution

368

Part XXI - Temporary, Transitional and Special Provisions

369 - 392

Part XXII - Short Title, Commencement, Authoritative Text in Hindi and Repeals

393 - 395

Parts of Indian Constitution Details

The Constitution of India is the supreme law of the land. It was adopted on 26 January 1950 and originally contained 395 Articles, 22 Parts, and 8 Schedules. Today, through amendments, it has expanded to 448 Articles, 25 Parts, and 12 Schedules.

Each Part of the Constitution deals with a specific subject - from Union and State structures to rights, duties, emergency provisions, and governance frameworks. 

Parts of Indian Constitution Details

Part

Articles Covered

Subject / Theme

Brief Explanation

Part I

Articles 1 - 4

The Union and its Territory

Defines India as a Union of States; regulates formation of new states and alteration of boundaries.

Part II

Articles 5 - 11

Citizenship

Lays down provisions for citizenship at the commencement of the Constitution and rules for acquisition/termination.

Part III

Articles 12 - 35

Fundamental Rights

Guarantees six categories of Fundamental Rights to citizens, inspired by the US Bill of Rights.

Part IV

Articles 36 - 51

Directive Principles of State Policy (DPSP)

Guidelines for the State to establish a just society; non-justiciable but fundamental to governance.

Part IVA

Article 51A

Fundamental Duties

Lists 11 duties of citizens, added by the 42nd Amendment (1976) on recommendation of Swaran Singh Committee.

Part V

Articles 52 - 151

The Union

Deals with the Union Government - Executive (President, PM, Council of Ministers), Parliament, and Judiciary.

Part VI

Articles 153 - 237

The States

Deals with State Governments - Governors, State Legislature, and High Courts.

Part VII

[Repealed]

States in Part B

Dealt with Part B states; repealed by the 7th Amendment (1956).

Part VIII

Articles 239 - 242

Union Territories

Provides for administration of Union Territories by the President through Administrators.

Part IX

Articles 243 - 243O

The Panchayats

Establishes Panchayati Raj system (73rd Amendment, 1992) for rural local self-government.

Part IXA

Articles 243P - 243ZG

The Municipalities

Establishes urban local bodies (74th Amendment, 1992) with structure, powers, and responsibilities.

Part IXB

Articles 243ZH - 243ZT

Co-operative Societies

Provides for regulation and management of co-operatives (97th Amendment, 2011).

Part X

Articles 244 - 244A

Scheduled and Tribal Areas

Deals with administration of Scheduled Areas (Fifth Schedule) and Tribal Areas (Sixth Schedule).

Part XI

Articles 245 - 263

Relations between the Union and States

Lays down legislative, administrative, and financial relations between the Centre and States.

Part XII

Articles 264 - 300A

Finance, Property, Contracts, and Suits

Covers distribution of revenues, borrowing powers, property rights, and legal suits involving government.

Part XIII

Articles 301 - 307

Trade, Commerce, and Intercourse

Ensures freedom of trade and commerce across India; modeled on Australian Constitution.

Part XIV

Articles 308 - 323

Services under Union and States

Covers recruitment, conditions of service, and role of Public Service Commissions.

Part XIVA

Articles 323A - 323B

Tribunals

Provides for Administrative Tribunals and other tribunals for speedy justice (42nd Amendment, 1976).

Part XV

Articles 324 - 329A

Elections

Deals with conduct of elections; empowers Election Commission of India.

Part XVI

Articles 330 - 342

Special Provisions for Certain Classes

Safeguards for SCs, STs, and Anglo-Indians, including reservation of seats.

Part XVII

Articles 343 - 351

Official Language

Declares Hindi in Devanagari script as official language; provides for use of English and development of regional languages.

Part XVIII

Articles 352 - 360

Emergency Provisions

Provides for National Emergency, President’s Rule, and Financial Emergency.

Part XIX

Articles 361 - 367

Miscellaneous

Covers protection of President/Governors, privy purses, interpretation of Constitution, etc.

Part XX

Article 368

Amendment of the Constitution

Provides the procedure for constitutional amendments - flexible yet rigid.

Part XXI

Articles 369 - 392

Temporary, Transitional, and Special Provisions

Deals with temporary and special provisions for certain states and union territories.

Part XXII

Articles 393 - 395

Short title, Commencement, Authoritative Text, Repeals

Specifies short title, date of commencement, authoritative text in Hindi, and repeals of previous laws.

Parts of Indian Constitution FAQs

Q1: Are there 22 or 25 parts in the Indian Constitution?

Ans: Originally, the Constitution had 22 parts, but after subsequent amendments and additions, it now has 25 parts.

Q2: Why is part 7 removed?

Ans: Part 7 dealt with Part-B states. After the 7th Constitutional Amendment, 1956, Part-B states were merged with others, making this part redundant, so it was repealed.

Q3: What is part 8 of the Indian Constitution?

Ans: Part 8 (Articles 239-242) deals with Union Territories, their administration, governance, and special provisions.

Q4: What are the articles 1, 2, 3, 4, 5 of the Constitution?

Ans: Article 1 - India, that is Bharat, is a Union of States, Article 2 - Admission/establishment of new States, Article 3 - Formation of new States and alteration of areas/boundaries, Article 4 - Laws under Articles 2 & 3 not amendments under Article 368, Article 5 - Citizenship at the commencement of the Constitution.

Q5: How to remember 25 parts of the Indian Constitution?

Ans: Use a mnemonic chain technique. For example: “The Union’s State Needs Citizenship, Directive Policies, Emergency Provisions, Panchayati Raj, Tribunals...” linking each part in order with keywords.

Dravidian Style of Temple Architecture, Contribution of Pallavas & Cholas

Dravidian Style

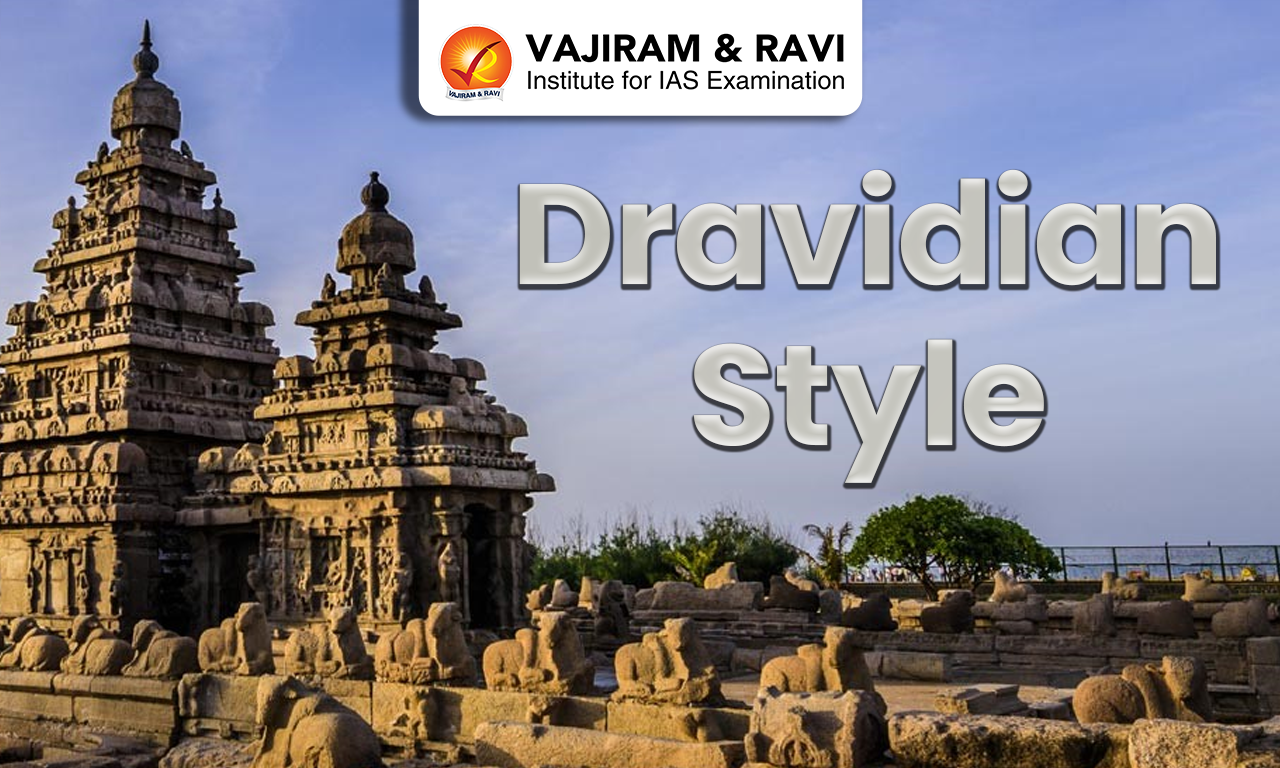
Dravidian Style of Temple Architecture is a South Indian tradition known for its grand temples with pyramid-shaped towers called vimanas and tall gateway towers known as gopurams. It developed under dynasties like the Pallavas and Cholas and is described in texts like the Vastu Shastra. These temples are built within large enclosures and include halls, water tanks, and detailed stone carvings. Famous examples such as the Brihadisvara Temple highlight its scale, symmetry, and artistic excellence.

Dravidian Style of Temple Architecture Features

Dravidian temples are known for their grandeur, symmetry, and intricate craftsmanship. The following are the defining characteristics:

  • High Boundary Walls: Temples are enclosed within massive rectangular walls, separating sacred space from the outside world.
  • Gopuram (Gateway Tower): Tall, pyramidal entrance towers dominate the temple complex, often more prominent than the central shrine in later periods.
  • Panchayatan Layout: The temple complex typically includes a main shrine surrounded by four subsidiary shrines.
  • Vimana (Main Tower): A stepped pyramidal structure rising above the sanctum (garbhagriha), unlike the curved shikhara of North India.
  • Single Vimana Principle: Only the main shrine has a vimana, while subsidiary shrines usually lack it.
  • Shikhara: In Dravidian style, this refers to the crowning element above the vimana, often shaped like a dome or stupika.
  • Antarala (Vestibule): A passage connecting the mandapa (hall) to the garbhagriha (sanctum).
  • Sculptural Decoration: Entrances are adorned with figures like Dwarapalas, Yakshas, and Mithuna sculptures.
  • Temple Tank: Presence of a water reservoir within the complex for rituals and purification.
  • Multiple Enclosures: Large temples evolved with concentric walls and multiple gopurams.
  • Urban Centers: Temples functioned as religious, economic, and administrative hubs between the 8th and 12th centuries.

Famous Dravidian Style Temples in India

South India is home to some of the most iconic Dravidian-style temples:

  • Brihadisvara Temple – Built by Rajaraja Chola I in 1011 AD; one of the tallest temples in India.
  • Gangaikonda Cholapuram Temple – Built by Rajendra Chola I to celebrate his northern conquests.
  • Meenakshi Amman Temple – Famous for its colorful gopurams and intricate carvings.
  • Airavatesvara Temple – A UNESCO-listed Chola masterpiece.
  • Annamalaiyar Temple – Dedicated to Lord Shiva, associated with fire (Agni).
  • Kailashnath temple at Ellora

Contribution of Pallavas to Dravidian Architecture

The Pallavas (4th-9th century CE) were pioneers of Dravidian architecture, initiating a crucial shift from rock-cut cave temples to fully developed structural stone temples. They established core elements like vimana (tower), mandapa (pillared hall), and sculpted gateways, laying the foundation for the grand temple traditions of South India.

Key Contributions:

  • Evolution of Architectural Styles
    • Mahendra Style (c. 600-625 CE): Began with rock-cut cave temples featuring simple pillared mandapas instead of wood or brick structures.
    • Mamalla Style (c. 625-674 CE): Introduced monolithic rathas (chariots carved from single rocks), best seen at Pancha Rathas.
    • Rajasimha & Nandi Styles (c. 674-900 CE): Marked the emergence of structural, free-standing temples built with stone, including the Shore Temple and Kailasanatha Temple.
  • Development of Key Architectural Elements
    • Vimana: Multi-tiered pyramidal towers became a defining feature of Dravidian temples.
    • Mandapa: Large pillared halls were designed for rituals and gatherings.
    • Gopuram: Early gateway towers were introduced, later expanded significantly by the Cholas.
  • Excellence in Sculptural Art
    • Pallava temples are known for detailed narrative carvings and bas-reliefs.
    • A prime example is the Descent of the Ganga (Arjuna’s Penance), showcasing dynamic and realistic artistry.
  • Regional and Cultural Influence
    • Pallava architectural styles spread beyond India through maritime trade.
    • Influenced early temple architecture in Southeast Asia, including regions like Java and Cambodia.
  • Significant Monuments
    • Shore Temple - One of the earliest structural temples and a UNESCO World Heritage site.
    • Kailasanatha Temple - The most elaborate Pallava structural temple.
    • Pancha Rathas - Monolithic temples demonstrating diverse Dravidian forms.
    • Vaikunta Perumal Temple - Known for its architectural innovation and sculptural richness.

Contribution of Cholas to Dravidian Architecture

The Cholas (c. 850-1200 CE) transformed Dravidian architecture by perfecting large-scale structural stone temples and elevating them to monumental proportions. Moving beyond earlier Pallava traditions, they introduced massive granite constructions, towering vimanas, and highly refined sculptural art, setting new standards in temple architecture.

Dominance of Stone & Engineering Excellence

  • The Cholas replaced brick and rock-cut forms with massive granite structures.
  • Their temples showcased advanced engineering, allowing construction at unprecedented scales and heights.

Towering Vimana (Sanctum Tower)

  • The vimana became the most prominent feature, rising as a stepped pyramid.
  • These towers were significantly taller than earlier examples, symbolizing power and devotion.
  • The crowning element (shikhara) was often octagonal and dome-like.

Monumental Temple Tradition

  • Royal patronage led to the construction of grand temples such as the Brihadisvara Temple built by Rajaraja I.
  • The Gangaikonda Cholapuram Temple built by Rajendra I further refined this style.
  • These temples are now recognized as UNESCO World Heritage monuments.

Evolution of Gopurams and Temple Layout

  • Gopurams (gateway towers) became more elaborate and decorative, though still secondary to the vimana in this period.
  • Temples featured high enclosure walls and expansive courtyards, reflecting organized spatial planning.

Intricate Sculpture and Iconography

  • Chola temples are renowned for detailed carvings depicting deities, mythological scenes, and celestial beings.
  • Sculptures were both decorative and symbolic, enhancing the spiritual atmosphere.
  • The iconic Nataraja form of Lord Shiva represents the peak of Chola artistic achievement.

Refinement of Structural Components

  • Development of key architectural elements such as:
    • Ardha-mandapa (entrance porch)
    • Maha-mandapa (main assembly hall)
    • Nandi-mandapa (pavilion for Nandi, Shiva’s mount)
  • These additions improved both functionality and aesthetic balance.

Dravidian Style of Temple Architecture FAQs

Q1: What is the Dravidian style of temple architecture?

Ans: Dravidian style is a South Indian temple architecture tradition characterized by pyramidal vimanas (towers), large gopurams (gateway towers), enclosed temple complexes, and intricate stone carvings.

Q2: Where did Dravidian architecture originate?

Ans: It originated in South India, especially in present-day Tamil Nadu, Karnataka, Andhra Pradesh, Telangana, and Kerala, and also spread to parts of Sri Lanka.

Q3: Which ancient text mentions Dravidian temple architecture?

Ans: It is described in the Vastu Shastra as one of the three main styles of temple architecture in India.

Q4: What is a vimana in Dravidian temples?

Ans: A vimana is the stepped pyramidal tower built directly above the sanctum (garbhagriha), forming the core structure of the temple.

Q5: What is the role of a gopuram?

Ans: A gopuram is a tall, decorative entrance gateway that marks entry into the temple complex and often becomes the most visually dominant feature in later Dravidian temples.

Important Days in March 2026, National and International Days List

Important Days in March 2026

March 2026 includes several national and international important days observed for awareness, historical remembrance, environmental protection and cultural celebrations. The month of March marks the end of India’s financial year and the beginning of the spring season. From global campaigns on wildlife and water conservation to national observances honouring freedom fighters and security forces. Important Days in March 2026 carries academic, cultural and social importance for students and aspirants preparing for competitive examinations.

Important Days in March 2026 List

The list for the National and International Important Days in March 2026 has been tabulated below:

Important Days in March 2026

Dates

Events

1 March

World Civil Defence Day; Zero Discrimination Day

3 March

World Wildlife Day; Holi (Holika Dahan)

4 March

National Safety Day; Dhulandi

8 March

International Women’s Day

12 March

CISF Raising Day; Anniversary of Dandi March

15 March

Pi Day; World Consumer Rights Day; International Day of Action for Rivers

16 March

National Vaccination Day

18 March

National Vaccination Day (awareness observance reference)

20 March

Ordnance Factory Day; International Day of Happiness; World Sparrow Day; Eid-ul-Fitr (Tentative)

21 March

International Day of Forests; World Poetry Day

22 March

World Water Day

23 March

World Meteorological Day; Shaheed Diwas (Martyrs’ Day)

24 March

World Tuberculosis Day

27 March

World Theatre Day; Ram Navami

31 March

Mahavir Jayanti

Important Days in March 2026 in India and World

March is widely recognised for global awareness campaigns, national commemorations and religious festivals. Below is a date-wise explanation of the major observances. The major Important Days in March 2026 in India and World include:

1 March: Zero Discrimination Day and World Civil Defence Day

Zero Discrimination Day promotes equality and inclusion without bias based on gender, caste, race, or background. World Civil Defence Day recognises the efforts of organisations working to protect people from disasters and emergencies.

3 March: World Wildlife Day and Holika Dahan

World Wildlife Day highlights the importance of conserving wild animals and plant species. On the same day, Holika Dahan marks the symbolic victory of good over evil and begins the festival of colours in India.

4 March: National Safety Day and Dhulandi (Holi)

National Safety Day, also known as Rashtriya Suraksha Diwas, spreads awareness about workplace safety and accident prevention. Dhulandi is the main Holi celebration when people play with colours and water.

8 March: International Women’s Day

This global observance celebrates the achievements of women in social, political, economic and cultural fields. It also promotes gender equality and empowerment.

12 March: CISF Raising Day and Dandi March Anniversary

CISF Raising Day honours the Central Industrial Security Force for safeguarding vital institutions. The anniversary of the Dandi March commemorates the day Mahatma Gandhi began the Salt Satyagraha in 1930.

15 March: Pi Day, World Consumer Rights Day and International Day of Action for Rivers

Pi Day recognises the mathematical constant π (3.14). World Consumer Rights Day promotes awareness about consumer protection and fair trade practices. The International Day of Action for Rivers focuses on protecting rivers and freshwater ecosystems.

16 March: National Vaccination Day

First observed in 1995 when the Oral Polio Vaccine was administered in India, this day stresses the importance of immunisation in preventing life-threatening diseases.

20 March: Ordnance Factory Day, International Day of Happiness and World Sparrow Day

Ordnance Factory Day acknowledges India’s defence manufacturing sector. The International Day of Happiness promotes well-being. World Sparrow Day raises awareness about conserving urban bird populations. Eid-ul-Fitr may also fall around this date depending on moon sighting.

21 March: International Day of Forests and World Poetry Day

International Day of Forests emphasises the importance of forest conservation and sustainable management. World Poetry Day celebrates creative literary expression across cultures.

22 March: World Water Day

World Water Day focuses on freshwater conservation and sustainable water management practices worldwide.

23 March: World Meteorological Day and Shaheed Diwas

World Meteorological Day commemorates the establishment of the World Meteorological Organization and highlights climate and weather awareness. Shaheed Diwas honours the sacrifices of Bhagat Singh, Sukhdev Thapar and Shivaram Rajguru.

24 March: World Tuberculosis Day

This day marks the discovery of the TB bacillus and spreads awareness about prevention and treatment of tuberculosis.

27 March: World Theatre Day and Ram Navami

World Theatre Day celebrates performing arts and cultural expression. Ram Navami marks the birth anniversary of Lord Rama.

31 March: Mahavir Jayanti

Mahavir Jayanti commemorates the birth of Lord Mahavir and holds great significance for the Jain community.

Important Days in March 2026 FAQs

Q1: Why is National Vaccination Day observed in March?

Ans: National Vaccination Day is observed on 16 March to highlight the importance of immunisation, first marked in 1995 with the administration of the Oral Polio Vaccine in India.

Q2: Which major international days are observed in March 2026?

Ans: Important global observances include World Wildlife Day (3 March), International Women’s Day (8 March), World Water Day (22 March) and World Tuberculosis Day (24 March).

Q3: What is the significance of 23 March in India?

Ans: 23 March is observed as Shaheed Diwas to honour the sacrifices of Bhagat Singh, Sukhdev Thapar and Shivaram Rajguru.

Q4: Which environmental awareness days are celebrated in March 2026?

Ans: World Wildlife Day, International Day of Forests, World Water Day and World Sparrow Day focus on wildlife, forests, water conservation and bird protection.

Q5: What major festivals will be celebrated in March 2026?

Ans: Holi, Chaitra Navratri, Gudi Padwa, Ugadi, Ram Navami, Eid-ul-Fitr (tentative) and Mahavir Jayanti are key festivals observed in March 2026.

Capitalism, Meaning, Types, Features, Pros & Cons

Capitalism

Capitalism is an economic system in which individuals and businesses own property and resources. In this system, people are free to produce, buy, and sell goods and services based on demand and supply. The main goal is to earn profit, and competition among businesses helps improve quality and innovation. Overall, capitalism encourages personal freedom, economic growth, and choice in the marketplace.

Types of Capitalism

Capitalism exists in different forms around the world. These types vary based on how much control the government has and how businesses operate. Some important types are explained below in simple terms:

  • Mercantilism: This is an early form of capitalism where the government strongly controls trade and works to increase national wealth. It often supported business expansion and was linked with colonialism and empire-building.
  • Free-Market Capitalism: In this system, the market runs mostly on its own. Prices of goods and services are decided by demand and supply, with very little government interference. Countries like the U.S. and U.K. are examples.
  • Social Market Economy: This type balances free markets with government support. While businesses operate freely, the government provides welfare services like healthcare, unemployment benefits, and protects workers’ rights. It is common in countries like Germany.
  • Rhine Capitalism: Found mainly in Western Europe, this model focuses on cooperation between businesses, workers, and the government. It follows the social market idea but gives more importance to long-term stability and worker welfare.
  • State Capitalism: In this system, the government owns and runs major industries or businesses. However, these businesses still aim to make profits like private companies.
  • Corporate Capitalism: This type is dominated by large companies and corporations. These organizations have structured management systems and play a major role in the economy, as seen in countries like Japan and South Korea.
  • Mixed Economy: A mixed economy combines both private and government ownership. Businesses operate freely, but the government steps in to fix problems like unemployment, inflation, and inequality.

Positive Impact of Capitalism

  • Economic Growth and Innovation: Capitalism encourages competition and new ideas. Businesses try to improve products and services, leading to economic growth and technological progress.
  • Individual Freedom and Choice: People have the freedom to choose their jobs, start businesses, and decide what to buy or invest in, giving them more control over their lives.
  • Efficient Use of Resources: Prices and demand help decide what should be produced, ensuring better use of resources and reducing waste.
  • Wealth Creation and Better Living Standards: It helps generate wealth through production and job creation, improving overall living standards.
  • Encourages Productivity and Innovation: The profit motive pushes individuals and companies to work efficiently and develop new ideas.
  • Wide Variety of Goods and Services: Competition leads to more choices for consumers, with better quality products available in the market.
  • Encourages Entrepreneurship: Capitalism supports people in starting their own businesses, which creates jobs and boosts the economy.
  • Flexibility and Adaptability: Markets can quickly adjust to changes in demand, technology, and consumer needs.
  • Global Trade and Opportunities: Capitalism promotes international trade, allowing countries to exchange goods and services and grow economically.

Negative Impact of Capitalism

  • Income Inequality: Capitalism can create a gap between the rich and the poor. A small group of people may earn a lot of wealth, while others struggle to meet basic needs.
  • Social and Economic Exclusion: The focus on profit may leave behind weaker sections of society, limiting their access to jobs, education, and opportunities.
  • Market Failures: Sometimes markets do not work perfectly. Issues like monopolies, unfair competition, or lack of proper information can lead to inefficiency and unfair outcomes.
  • Environmental Damage: Businesses may focus more on profit than protecting the environment, which can lead to pollution, overuse of resources, and ecological harm.
  • Economic Instability: Capitalist economies can face ups and downs, including recessions, financial crises, and sudden job losses.
  • Worker Exploitation: In some cases, workers may be underpaid or overworked as companies try to reduce costs and increase profits.
  • Overemphasis on Profit: Too much focus on profit can reduce attention to social welfare, ethics, and public well-being.
  • Consumerism and Materialism: Capitalism can encourage people to buy more than they need, leading to waste and an overdependence on material goods.
  • Unequal Access to Basic Services: Important services like healthcare and education may become expensive, making them harder to access for poorer sections of society.
  • Short-Term Focus: Businesses may prioritize quick profits over long-term sustainability and stability, which can harm the economy and society in the long run.

Indian Style of Capitalism

  • Mixed Economic Model: The Indian style of capitalism is based on a mixed economy, where both the government and private sector play important roles in economic development.
  • Balance Between State and Market: It combines government intervention with market forces. While businesses operate freely, the government regulates key sectors and ensures fair practices.
  • Focus on Inclusive Growth: A major goal is to ensure that economic growth benefits all sections of society, including the poor and marginalized groups.
  • Support for Entrepreneurship: India encourages startups and small businesses, promoting innovation and job creation through schemes and policies.
  • Use of Demographic Advantage: India’s large and youthful population is seen as a strength, contributing to workforce growth and economic expansion.
  • Government Welfare Programs: The government provides support through schemes related to education, healthcare, food security, and employment to improve living standards.
  • Regulation and Public Sector Role: Important sectors like banking, infrastructure, and energy often involve government participation to maintain stability and development.
  • Challenges and Limitations: The system faces issues like bureaucracy, slow decision-making, corruption, and inequality, which can affect growth.
  • Adaptation to Indian Needs: This model is designed to suit India’s social and economic conditions, balancing development with social justice.
  • Goal of Sustainable Growth: Overall, it aims to achieve steady economic growth while ensuring social welfare and reducing inequality.

Major Thinkers and Their Ideas on Capitalism

  • Adam Smith: Adam Smith is often called the “father of modern economics.” In his famous book The Wealth of Nations, he explained the idea of the “invisible hand.” This means that when individuals work for their own benefit, it can indirectly help society as a whole. He strongly supported free markets, competition, and limited government interference, believing these lead to economic growth and efficiency.
  • Karl Marx: Karl Marx had a critical view of capitalism. He believed that capitalism creates inequality and exploits workers. According to him, society is divided into two main classes: the bourgeoisie (owners of businesses) and the proletariat (workers). He argued that workers are often underpaid while owners gain most of the profits. Marx believed this system would eventually lead to conflict and should be replaced by a more equal system like socialism.
  • John Maynard Keynes: Keynes introduced the idea that markets do not always work perfectly on their own. He believed that during economic downturns, the government should step in to support the economy. Through policies like increased public spending and tax changes, governments can boost demand, create jobs, and maintain stability. His ideas became especially important during times of economic crisis.

Difference Between Communism, Capitalism and Socialism

Communism, capitalism, and socialism are three different economic systems that explain how a country manages its resources, wealth, and production. Each system has its own approach to ownership, government role, and distribution of wealth. The key differences between them are discussed below.

Difference Between Communism, Capitalism and Socialism

Aspect

Capitalism

Socialism

Communism

Ownership of Resources

Resources and businesses are owned by private individuals or companies.

Major industries are owned or controlled by the government or society.

All property and resources are owned collectively by the community; no private ownership.

Economic System

Based on free markets where demand and supply decide prices and production.

A mix of market system and government planning.

Fully controlled by the government with central planning.

Wealth Distribution

Wealth is uneven and depends on effort, skills, and investment.

Tries to reduce inequality through taxes and welfare schemes.

Aims for complete equality where everyone gets an equal share.

Incentives to Work

People are motivated by profit and personal success.

Motivation comes from both personal benefit and social welfare.

People work for the common good rather than personal profit.

Role of Government

Limited role; mainly maintains law, order, and property rights.

Active role in managing the economy and providing public services.

Strong control over the economy and often other aspects of life.

Examples

USA, UK (with some welfare policies).

Sweden, Norway, India (mixed systems).

Former USSR, North Korea, Cuba (with variations).

Individual Freedom

High freedom in business and personal choices.

Moderate freedom with some regulations.

Limited freedom as the state has strong control.

Decision Making

Decisions are made by individuals and businesses.

Shared between government and market forces.

Decisions are made by the central authority (government).

Focus of System

Profit, growth, and competition.

Balance between equality and growth.

Equality and collective welfare.

Social Welfare

Limited, depends on government policies.

Strong focus on welfare programs like healthcare and education.

Welfare is provided equally by the state.

Capitalism FAQs

Q1: What is capitalism?

Ans: Capitalism is an economic system where individuals and businesses own resources and make decisions about production and trade. It is based on profit, competition, and free markets.

Q2: What are the main types of capitalism?

Ans: Some common types include free-market capitalism, state capitalism, corporate capitalism, social market economy, and mixed economy. These differ mainly in the level of government involvement.

Q3: What are the advantages of capitalism?

Ans: Capitalism promotes economic growth, innovation, individual freedom, and a wide variety of goods and services. It also encourages entrepreneurship and job creation.

Q4: What are the disadvantages of capitalism?

Ans: It can lead to income inequality, environmental damage, worker exploitation, and economic instability. It may also create unequal access to basic services like healthcare and education.

Q5: How does capitalism work in India?

Ans: India follows a mixed economic model where both the government and private sector play important roles. It focuses on inclusive growth, welfare programs, and supporting businesses.

Underground Coal Gasification (UCG), Process, Benefits, Risks

Underground Coal Gasification

Recently, the Ministry of Coal formalised Coal Mine/Block Production and Development Agreements (CMDPAs) with selected bidders for four coal blocks, introducing provisions for Underground Coal Gasification for the first time within India’s commercial coal mining regime.

About Underground Coal Gasification (UCG)

Underground Coal Gasification (UCG) is a thermo-chemical process in which coal is partially combusted underground using controlled injection of oxygen (or air) and steam. This produces syngas, primarily composed of hydrogen (H₂), carbon monoxide (CO), methane (CH₄), and carbon dioxide (CO₂), which is extracted through wells and used for power generation, chemicals, or hydrogen production.

Process of Underground Coal Gasification

The process requires careful engineering and control to ensure that gasification occurs efficiently inside the coal seam.

  • Injection well: Oxygen or air along with steam is injected into the coal seam
  • Linkage or channel formation: A connection is created between the injection and production wells. This is achieved through techniques such as directional drilling or controlled combustion so that gases can move through the coal seam
  • Gasification zone: High-temperature reactions convert coal into synthesis gas through oxidation, reduction, and thermal decomposition
  • Production well: The gas produced is collected and transported to the surface for further use.

Advantages of Underground Coal Gasification

The advantages of Underground Coal Gasification lie in its ability to combine efficient resource utilisation with lower costs and reduced environmental impact, while also strengthening energy security.

  • Efficient use of resources: This method allows access to large quantities of coal that would otherwise remain unused due to technical or economic limitations.
  • Cost advantages: Since mining, transportation, and surface gasification infrastructure are not required, the overall cost can be lower compared to conventional gasification methods.
  • Reduced surface impact: There is significantly less damage to land and ecosystems because the coal is not excavated.
  • Improved safety: The risks associated with underground mining, such as accidents and exposure to hazardous conditions, are largely avoided.
  • Contribution to energy security: It can help countries like India make better use of domestic energy resources and reduce dependence on imports.

Underground Coal Gasification Environmental Risks and Challenges

  • Groundwater contamination through leaching: After the gasification process ends, groundwater may enter the underground cavity and dissolve residual chemicals. This can create contaminated liquid known as leachate, which may contain toxic substances such as phenols and complex hydrocarbons.
  • Carbon emissions: Although more efficient than traditional coal use, the process still produces carbon dioxide, which contributes to climate change concerns.
  • Land subsidence: The collapse of underground cavities may lead to sinking of the land surface, affecting infrastructure and ecosystems.
  • Technical and regulatory complexity: The process requires continuous monitoring, detailed geological assessment, and strict regulation to ensure safety and environmental protection.

Underground Coal Gasification in India

India has large coal reserves, a significant part of which lies deep underground and cannot be mined easily. To utilise these resources, the Ministry of Coal has been promoting Underground Coal Gasification through: 

  • Policy support and incentives such as viability gap funding and reduced revenue sharing for gasification projects.
  • A major development took place in April 2026, when the government signed Coal Mine/Block Production and Development Agreements (CMDPAs) for four coal blocks under commercial mining.
  • For the first time, these agreements included provisions for Underground Coal Gasification, marking its shift towards commercial use.
  • Under this, Reliance Industries Limited was awarded the Recherla and Chintalpudi Sector A1 blocks in Andhra Pradesh, while Axis Energy Ventures secured the Dip Extension of Belpahar and Tangardihi East blocks in Odisha.
  • This step allows companies to use both conventional mining and gasification methods, improving the value obtained from coal. The gas produced can be used in fertilisers, petrochemicals, and synthetic fuels, helping reduce dependence on imports and strengthening India’s energy and food security.

Underground Coal Gasification FAQs

Q1: What is Underground Coal Gasification (UCG)?

Ans: Underground Coal Gasification (UCG) is a process in which coal is converted into a combustible gas while it remains underground, avoiding the need for conventional mining.

Q2: What is synthesis gas (syngas) produced through Underground Coal Gasification (UCG)?

Ans: Synthesis gas (syngas) is a mixture of gases such as hydrogen, carbon monoxide, methane, and carbon dioxide, which can be used for power generation, fertilisers, and chemical production.

Q3: How does the Underground Coal Gasification (UCG) process work?

Ans: It involves injecting air or oxygen and steam into a coal seam, creating a controlled underground reaction that converts coal into gas, which is then extracted through production wells.

Q4: What are the main advantages of Underground Coal Gasification (UCG)?

Ans: It allows utilisation of deep coal reserves, reduces surface damage, lowers costs, improves safety, and strengthens energy security.

Q5: What are the environmental concerns associated with Underground Coal Gasification (UCG)?

Ans: The process may lead to groundwater contamination through leaching, carbon emissions, land subsidence, and requires strict monitoring and regulation.

Privy Purse, Meaning, History, Purpose, Abolishment, Cases

Privy Purse

Privy Purse was a tax free payment given to former princely rulers after India’s independence to ensure smooth political integration. The Privy Purse system emerged during 1947-49 as rulers surrendered sovereignty and merged their states with the Union of India. It was constitutionally protected under Article 291 and continued until 1971. The Privy Purse later became controversial and was abolished to promote equality and remove hereditary privileges.

Privy Purse Historical Background

After independence, India faced the challenge of integrating more than 560 princely states into a unified nation through agreements and political negotiations.

  • Integration of Princely States: At independence in 1947, around 555-565 princely states existed, covering nearly 48% of India’s area and 28% population. They acceded through Instruments of Accession, surrendering defence, foreign affairs and communications powers.
  • Role of Leaders: Vallabhbhai Patel and V. P. Menon played a key role in convincing rulers of states like Hyderabad, Bhopal and Travancore to join India peacefully through diplomatic negotiations and agreements.
  • Merger Agreements: Between 1948 and 1949, states signed Merger Agreements or Covenants of Integration, transferring complete administrative control and revenues to India in return for Privy Purse payments and privileges.
  • Political Necessity: The Privy Purse arrangement was designed to avoid conflicts, ensure administrative stability and prevent fragmentation of India during the sensitive transition from monarchy to democracy.

Privy Purse Purpose

The Privy Purse system aimed to compensate rulers for surrendering sovereignty and maintain stability during India’s transition to a democratic republic.

  • Compensation Mechanism: Privy Purse payments were given as compensation for rulers who gave up ruling powers, state revenues and public assets while merging their territories into the Indian Union.
  • Financial Support: These payments covered personal expenses of royal families, including religious ceremonies, household maintenance and traditional obligations associated with their former status.
  • Political Stability: The arrangement ensured peaceful integration by avoiding resistance from powerful rulers, thus preventing internal conflicts and ensuring unity of newly independent India.
  • Transitional Device: Privy Purse was considered a temporary arrangement to ease the shift from princely rule to democratic governance, not a permanent entitlement.
  • Variation in Amounts: Privy Purse payments varied widely based on state revenue and status. States like Hyderabad, Mysore, Travancore, Baroda, Jaipur, Patiala, Nawanagar, Bhavnagar, Rewa, Bhopal and Kolhapur received ₹1,000,000 or more annually, while about 100 rulers got ₹100,000+ and smaller states received amounts as low as ₹5,000 per year.

Also Check: Nizam of Hyderabad

Privy Purse Constitutional Framework

The Privy Purse system had a strong constitutional basis that ensured its legality and protection until its removal in 1971.

  • Article 291: It guaranteed Privy Purse payments as tax free sums charged on the Consolidated Fund of India, making them secure and not subject to parliamentary vote or reduction.
  • Article 366(22): This provision defined rulers and allowed the President to recognize them, forming the legal basis for granting Privy Purse and associated privileges.
  • Article 362: It directed the government to respect rights and privileges promised to rulers under merger agreements, though it was non justiciable in nature.
  • Article 363A: Introduced by the 26th Amendment, it ended recognition of rulers and abolished all privileges, including Privy Purse, making such claims legally invalid.

Privy Purse Abolishment

The Privy Purse system faced criticism over time and was finally abolished in 1971 after political and legal challenges.

  • 1970 Constitutional Attempt: A proposal to abolish Privy Purse was passed in Lok Sabha but failed in Rajya Sabha by one vote, lacking the required two-thirds majority.
  • Presidential Order 1970: The President issued an order under Article 366(22) withdrawing recognition of rulers, stopping Privy Purse payments, which was later challenged in the Supreme Court.
  • Supreme Court Judgment: The Supreme Court ruled in favour of rulers, stating that constitutional guarantees could not be removed through executive action without proper constitutional amendment.
  • 26th Amendment 1971: The Constitution (Twenty Sixth Amendment) Act, 1971 abolished Privy Purse, removed recognition of rulers and ended all privileges granted under earlier agreements.

Privy Purse Case Laws

Legal disputes around Privy Purse played an important role in shaping constitutional interpretation and limits of executive power.

  • In Madhav Rao Scindia Case 1971, former rulers challenged the Presidential order abolishing Privy Purse and the Supreme Court ruled that executive action could not override constitutional provisions.
  • The judgment established that rights guaranteed by the Constitution can only be altered through formal constitutional amendments, not administrative decisions.
  • After the 26th Amendment, legal challenges became ineffective due to Article 363A, which barred judicial review on matters related to former rulers’ privileges.
  • Courts later emphasized that continued use of royal titles violates constitutional principles under Article 14 and Article 18, reinforcing equality and abolition of hereditary distinctions.

Privy Purse FAQs

Q1: What was the Privy Purse in India?

Ans: Privy Purse was a tax free annual payment given to former princely rulers for surrendering their ruling powers after independence.

Q2: Why was the Privy Purse introduced?

Ans: It was introduced to ensure smooth and peaceful integration of princely states into the Indian Union without conflict.

Q3: When was the Privy Purse abolished?

Ans: Privy Purse was abolished in 1971 through the Constitution (Twenty Sixth Amendment) Act.

Q4: Which Article of the Constitution of India guaranteed Privy Purse?

Ans: Article 291 of the Indian Constitution guaranteed Privy Purse payments as charged expenditure from the Consolidated Fund of India.

Q5: Why was the Privy Purse abolished?

Ans: It was abolished to promote equality, remove special privileges and reduce government expenditure in a democratic system.

Kalinga Architecture, Features, Types, Significance

Kalinga architecture

Kalinga architecture is one of the most refined and regionally distinct styles of Indian temple architecture, originating in the ancient land of Kalinga (modern-day Odisha). Known for its intricate carvings, towering shikharas, and symbolic layouts, this architectural tradition reflects a harmonious blend of spirituality, engineering excellence, and artistic mastery. The grand Jagannath Temple stands as a timeless example of the maturity and devotional depth of Kalinga temple architecture.

Kalinga Architecture Key Features

Kalinga temples are known for their distinctive design elements and elaborate detailing.

  • Vertical Emphasis: Temples are built with a strong vertical orientation, symbolizing a connection between earth and the divine.
  • Curvilinear Shikhara: The tower above the sanctum is often curvilinear, rising smoothly and bending inward at the top.
  • Intricate Carvings: Walls are adorned with sculptures depicting gods, dancers, mythical creatures, and everyday life.
  • Use of Stone: Structures are primarily built using sandstone and laterite, showcasing durability and craftsmanship.
  • Amalaka and Kalasha: The top of the shikhara is crowned with an amalaka (ribbed stone disk) and a kalasha (finial), representing cosmic elements.
  • Symbolism: Every architectural component holds spiritual significance, representing cosmic order and divine presence.

Types of Kalinga Temples

Kalinga temple architecture is broadly classified into three main types, each with unique structural and functional characteristics:

1. Rekha Deula

Rekha Deula is the most prominent and sacred temple type, primarily used to house the main deity.

  • Purpose: Sanctum sanctorum (Garbhagriha)
  • Ground Plan: Square
  • Shikhara Style: Tall, curvilinear tower that rises vertically and bends inward near the top
  • Distinct Feature: Vertical lines (Rekhas) run from the base to the top
  • Principal Deities: Vishnu, Shiva, Surya

Examples:

2. Pidha Deula

Pidha Deula structures are typically used as assembly or offering halls attached to the main shrine.

  • Purpose: Jagamohana (assembly hall), Natamandira (dance hall), Bhogamandapa (offering hall)
  • Ground Plan: Square
  • Shikhara Style: Stepped pyramid with horizontal tiers (Pidhas)
  • Distinct Feature: Series of diminishing platforms stacked one above another
  • Symbolism: Represents ascending spiritual levels

Example:

3. Khakhara Deula

Khakhara Deula is a unique and less common type, often associated with goddess worship.

  • Purpose: Sanctum sanctorum
  • Ground Plan: Rectangular
  • Shikhara Style: Elongated, barrel-vaulted roof resembling a wagon vault
  • Distinct Feature: Inspired by ancient Valabhi-style shrines
  • Principal Deities: Chamunda, Durga

Example:

  • Baitala Deula

Kalinga Architecture Significance

  • Sacred Cosmology: Temple layout symbolizes the universe; the sanctum acts as the cosmic center (axis mundi).
  • Pilgrimage Importance: Major religious centres like the Jagannath Temple sustain living traditions of bhakti and rituals.
  • Engineering Precision: Advanced stone construction, interlocking systems, and load distribution without mortar.
  • Distinct Shikhara Forms: Clear typology, Rekha (curvilinear), Pidha (stepped), Khakhara (barrel-vaulted).
  • Iconographic Richness: Sculptures encode Puranic themes, temple rituals, and social life.
  • Cultural Archive: Visual record of dance, music, attire, and daily practices.
  • Regional Identity: Defines Odisha’s unique sub-style within Nagara architecture.
  • Mature Temple Planning: Axial alignment of Deula-Jagamohana-Natamandira-Bhogamandapa.
  • Artistic Excellence: High-relief carvings and refined ornamentation seen in Konark Sun Temple.
  • Continuity Over Centuries: Evolution from early forms to peak maturity (10th–12th CE).

Kalinga Architecture FAQs

Q1: What is Kalinga Architecture?

Ans: Kalinga architecture is a regional style of Hindu temple architecture that developed in Odisha. It is a sub-style of the Nagara style, known for its curvilinear towers, intricate carvings, and well-defined temple components.

Q2: Where did Kalinga architecture originate?

Ans: It originated in ancient Kalinga, corresponding to present-day Odisha and parts of eastern India.

Q3: What is the time period of Kalinga architecture?

Ans: This architectural style evolved from around the 4th century BCE to the 17th century CE, reaching its peak between the 10th and 12th centuries CE.

Q4: What are the main types of Kalinga temples?

Ans: There are three main types: Rekha Deula, Pidha Deula and Khakhara Deula

Q5: What is Rekha Deula?

Ans: Rekha Deula is the main sanctum structure with a tall, curvilinear shikhara, typically dedicated to deities like Shiva, Vishnu, or Surya.

BRICS Entrepreneurs Alliance, Mission, Structure, Functions, Role

BRICS Entrepreneurs Alliance

Bhaskar Jyoti Sonowal has been elected President of the BRICS Entrepreneurs Alliance (BEA) Global Forum for the 2026-27 term. He will lead global strategy for the BEA, focusing on trade, investments, and MSME growth, particularly as India prepares to host the BEA Global Summit in November 2026.

About BRICS Entrepreneurs Alliance

  • The BRICS Entrepreneurs Alliance was formally established in September 2025 during the II BRICS Forum on Traditional Values held in Brazil.
  • It reflects a shift in BRICS cooperation from purely intergovernmental engagement to people-to-people and business-to-business (B2B) collaboration.

MISSION of the BRICS Entrepreneurs Alliance

The mission of the BRICS Entrepreneurs Alliance (BEA) is to build a trust-based, globally connected, and socially responsible entrepreneurial ecosystem across BRICS+ countries.

  • To create a community where entrepreneurs from different countries can build mutual trust
  • To promote and strengthen a positive image of entrepreneurship across the BRICS+ nations
  • To actively engage in charitable initiatives through financial support and personal volunteering
  • To foster the development of entrepreneurship in BRICS+ countries.

BRICS Entrepreneurs Alliance Organisational Structure

The BEA has a structured global governance system:

  • General Council: Representatives from all national chapters
  • Global President: Selected annually (aligned with BRICS chairmanship)
  • Secretary General: Handles long-term coordination
  • National Chapters: Country-level units with entrepreneurs and business leaders

Functions of the BRICS Entrepreneurs Alliance (BEA)

  • International Community Building: Develops a global platform where entrepreneurs from different BRICS+ countries can interact, collaborate, and build mutual trust, which is essential for long-term cross-border partnerships.
  • Ensuring Reliability of Partners: Creates and maintains a verified registry of credible entrepreneurs and enterprises, reducing risks and enhancing confidence in international business dealings.
  • Comprehensive Business Support: Provides end-to-end assistance to entrepreneurs operating in BRICS markets, including regulatory guidance, market insights, and network access, making expansion smoother and more efficient.
  • Training and Capacity Building: Organises training programs, workshops, and knowledge-sharing initiatives to equip entrepreneurs with skills, market understanding, and global competitiveness required to succeed in new markets.

Humanitarian Cooperation

An important dimension of the BRICS Entrepreneurs Alliance (BEA) is its commitment to humanitarian engagement and social responsibility, which complements its economic objectives.

  • At the II BRICS Forum on Traditional Values (September 15–17, 2025, Brazil), the Alliance signed a cooperation agreement with the Volunteers of Peace, an international platform dedicated to connecting volunteers with humanitarian projects worldwide. 
  • This partnership reflects the BEA’s effort to align entrepreneurship with global welfare and community development.
  • The platform has already demonstrated tangible impact through medical missions in countries such as Uganda, the Democratic Republic of the Congo, Cameroon, and Zambia. These initiatives have: Trained nearly 500 doctors, Supplied critical medical equipment to hospitals and Strengthened healthcare delivery in underserved region.

BRICS Entrepreneurs Alliance FAQs

Q1: Who is the current President of the BRICS Entrepreneurs Alliance Global Forum?

Ans: Bhaskar Jyoti Sonowal has been elected President of the BRICS Entrepreneurs Alliance (BEA) Global Forum for the 2026-27 term.

Q2: When and where was the BRICS Entrepreneurs Alliance established?

Ans: The BEA was formally established in September 2025 during the II BRICS Forum on Traditional Values held in Brazil.

Q3: What is the core purpose of the BRICS Entrepreneurs Alliance?

Ans: The Alliance aims to build a trusted international entrepreneurial community, promote a positive image of entrepreneurship, support business expansion across BRICS+ countries, and integrate economic cooperation with social responsibility.

Q4: What is the mission of the BRICS Entrepreneurs Alliance?

Ans: The mission is to foster trust among entrepreneurs, strengthen the global perception of entrepreneurship, encourage charitable engagement, and develop entrepreneurial ecosystems across BRICS+ nations.

Q5: What is the organisational structure of the BEA?

Ans: The BEA operates through a multi-tier system comprising a General Council, a Global President, a Secretary General, and national chapters that implement initiatives at the country level.

Vajrayana Buddhism, Origin, Tantric Buddhism, Practices, Beliefs

Vajrayana Buddhism

Vajrayana Buddhism is a later form of Buddhism that focuses on reaching enlightenment in a faster and more direct way. It combines basic Buddhist teachings with special practices like meditation, mantras, and rituals. With the guidance of a teacher, it aims to help people develop wisdom and inner peace by transforming their thoughts and actions. Vajrayana Buddhism’s origin, Key Beliefs and other Features are discussed in detail in this article.

About Vajrayana Buddhism

  • Vajrayana Buddhism is a later development of Buddhism and is often called Tantric Buddhism or the Diamond Vehicle. The term “Vajra” means thunderbolt or diamond, symbolizing strength and clarity, while “Yana” refers to the spiritual path toward enlightenment.
  • Origin and Spread: Vajrayana developed in India around the early medieval period (around 6th-9th century CE) and later spread to regions like Tibet, Bhutan, Mongolia, and parts of Central Asia. In India, it flourished mainly in Bengal, Bihar, Ladakh, and Sikkim. It is closely associated with Tibetan Buddhism.
  • Connection with Mahayana Buddhism: This tradition is based on Mahayana Buddhism but introduces additional practices and beliefs. It combines philosophical ideas with practical rituals to make the path to enlightenment more direct.
  • Key Practices: Vajrayana emphasizes the use of tantras (sacred texts), mantras (chanting), and yantras (spiritual diagrams). These are believed to be powerful tools that help control the mind and achieve spiritual growth more quickly and are powerful methods for achieving liberation, as they involve advanced and meaningful spiritual practices.
  • Role of Guru (Teacher): A spiritual teacher or guru plays a very important role in Vajrayana Buddhism. Followers receive guidance and teachings directly from the guru to properly understand and practice the rituals.
  • Belief in Faster Enlightenment: One of the main ideas of Vajrayana is that it offers a quicker path to enlightenment compared to other Buddhist schools. It teaches that even ordinary life experiences can be transformed into steps toward spiritual awakening.
  • Importance of Female Deities: Vajrayana gives special importance to feminine energy. Deities like Tara are highly respected and seen as symbols of compassion and protection. She is often worshipped as a female Buddha and meditation deity.
  • Philosophical Ideas: Vajrayana teaches that wisdom and compassion must go together. It also explains that opposite ideas, such as emptiness and existence, are connected and must be understood as one for true enlightenment.
  • Cultural and Religious Influence: This tradition shows the influence of earlier Indian practices and rituals, blending them with Buddhist teachings. It includes symbolic language, meditation techniques, and sacred art like mandalas.

Also Read: Sects of Buddhism

Vajrayana Buddhism FAQs

Q1: What is Vajrayana Buddhism?

Ans: Vajrayana Buddhism is a later form of Buddhism, also known as Tantric Buddhism or the Diamond Vehicle. It focuses on achieving enlightenment quickly through meditation, rituals, and spiritual practices.

Q2: What does Vajrayana mean?

Ans: The term “Vajrayana” means “Diamond Path” or “Thunderbolt Vehicle.” “Vajra” symbolizes strength and clarity, while “Yana” means the path to spiritual enlightenment.

Q3: Where did Vajrayana Buddhism originate and spread?

Ans: Vajrayana Buddhism originated in India between the 6th and 9th centuries CE. It later spread to Tibet, Bhutan, Mongolia, and parts of Central Asia, becoming closely linked with Tibetan Buddhism.

Q4: How is Vajrayana Buddhism different from Mahayana Buddhism?

Ans: Vajrayana is based on Mahayana Buddhism but includes additional practices like tantras, mantras, and rituals. It is believed to offer a faster and more direct path to enlightenment.

Q5: What are the key practices of Vajrayana Buddhism?

Ans: The main practices include meditation, chanting mantras like “Om Mani Padme Hum,” using yantras (sacred diagrams), and following tantric rituals under the guidance of a teacher.

Maharatna, Navratna, and Miniratna, Eligibility, List, Benefits, Impact

Maharatna, Navratna, and Miniratna

Maharatna, Navratna, and Miniratna companies are special categories created by the Government of India to give selected Public Sector Undertakings more financial and operational freedom. These categories help strong-performing PSUs take quicker decisions, invest in large projects, and compete globally without waiting for multiple government approvals. PSUs are government-owned companies with at least 51 percent government stake. Their roles include developing heavy industries, boosting exports, reducing imports, and expanding infrastructure. Over the decades, PSUs have become one of India’s major economic pillars, contributing significantly to employment, industrialization, and national growth. Understanding their classification helps explain their functioning and importance.

What are Maharatna, Navratna, and Miniratna Status?

Maharatna, Navratna, and Miniratna are classifications created to reward high-performing Central Public Sector Enterprises (CPSEs) with different levels of autonomy. Maharatna companies enjoy the highest decision-making power and investment freedom. Navratna companies receive moderate autonomy, while Miniratna firms, divided into Category I and II, get limited but important operational independence. These categories depend on financial strength, profitability, net worth, and overall performance.

Maharatna, Navratna, and Miniratna Historical Background

The history of Maharatna, Navratna, and Miniratna categories reflects India’s effort to strengthen PSUs and push them towards financial and administrative autonomy.

  • After Independence, India needed rapid industrialization, leading to the creation of PSUs under the Industrial Policy Resolution of 1956.
  • PSUs were established in strategic sectors: communication, irrigation, chemicals, heavy industries, and energy.
  • By the 1990s, many PSUs were financially strong and required greater autonomy to compete globally.
  • In 1997, the government created the Navratna category to give nine top PSUs more powers.
  • Later, the Miniratna Category I and II classifications were introduced for profitable but smaller PSUs.
  • In 2010, the Maharatna Category was created to give the largest PSUs even greater financial independence.

Maharatna, Navratna, and Miniratna Definitions

The three classes of the companies can be defined as:

Maharatna

A Maharatna is the highest classification granted to the most financially strong, strategically important, and globally competitive CPSEs. These PSUs have very large investments, strong profits, and significant national importance. They are allowed to make large financial decisions without seeking government approval, enabling them to compete internationally. Maharatna companies represent India’s biggest public sector brands and play a major role in key areas such as energy, minerals, transportation, and heavy engineering.

Navratna

A Navratna is a mid-level classification awarded to strong-performing PSUs that meet specific financial and managerial criteria. To become a Navratna, a PSU must first qualify as a Miniratna and achieve a performance score of 60 out of 100 based on parameters like net worth, net profit, capital employed, manpower cost, and service cost. Navratna companies get moderate financial autonomy, enabling them to invest in projects up to a fixed limit. These companies show strong potential to grow into Maharatna status.

Miniratna

Miniratnas are profitable PSUs divided into two categories: Category I and Category II. They are financially stable but smaller than Navratna and Maharatna companies. Category I companies can invest up to ₹500 crore or their net worth, while Category II companies can invest up to ₹300 crore or 50 percent of net worth. Miniratnas are important regional and sectoral PSUs and often serve as the foundation for future Navratna-level performance.

Maharatna, Navratna, and Miniratna Eligibility Criteria

Each category has clear financial and performance-based criteria that determine whether a PSU qualifies as a Maharatna, Navratna, or Miniratna.

Maharatna Eligibility Criteria

  • Having Navratna status
  • Listed on Indian stock exchange with minimum prescribed public shareholding under SEBI regulations
  • An average annual turnover of more than Rs. 25,000 crore during the last 3 years
  • An average annual net worth of more than Rs. 15,000 crore during the last 3 years
  • An average annual net profit after tax of more than Rs. 5,000 crore during the last 3 years
  • Should have significant global presence/international operations.

Navratna Eligibility Criteria

Central Public Sector Enterprises (CPSEs) that hold Miniratna Category–I status, fall under Schedule ‘A’, and have achieved an ‘Excellent’ or ‘Very Good’ Memorandum of Understanding (MoU) rating in at least three out of the last five years are eligible to be considered for Navratna status. Additionally, the CPSE must obtain a composite score of 60 or above based on six selected performance indicators, which together carry a maximum weight of 100 marks.

Performance Indicator Maximum Weight
Net Profit to Net Worth 25
Manpower Cost to Total Cost of Production / Cost of Services 15
PBDIT to Capital Employed 15
PBIT to Turnover 15
Earnings Per Share (EPS) 10
Inter-Sectoral Performance 20
Total 100

Miniratna Eligibility Criteria

  • Miniratna Category-I status: - The CPSEs which have made profit in the last three years continuously, pre-tax profit is Rs.30 crores or more in at least one of the three years and have a positive net worth are eligible to be considered for grant of Miniratna-I status.

  • Miniratna Category-II status: - The CPSEs which have made profit for the last three years continuously and have a positive net worth are eligible to be considered for grant of Miniratna-II status.
    • Miniratna CPSEs should have not defaulted in the repayment of loans/interest payment on any loans due to the Government.
    • Miniratna CPSEs shall not depend upon budgetary support or Government guarantees.

Also Read: SEBI

Maharatna, Navratna, and Miniratna Impact

These classifications significantly impact India’s industrial growth, economic performance, and the global competitiveness of public sector enterprises.

Maharatna Impact

  • Drive India’s energy, minerals, and infrastructure sectors
  • Lead global expansion of Indian PSUs
  • Generate high revenue and profit for the country
  • Strengthen national strategic capacity

Navratna Impact

  • Support mid-level industrial growth
  • Enhance competitiveness of key sectors
  • Strengthen domestic manufacturing and services
  • Improve financial efficiency within the PSU ecosystem

Miniratna Impact

  • Promote regional development
  • Strengthen smaller industrial sectors
  • Convert profitable PSUs into stronger enterprises
  • Serve as a talent and development base for future Navratnas

Maharatna, Navratna, and Miniratna Significance

These categories help the government strengthen PSUs while promoting financial discipline, competitiveness, and strategic development.

Maharatna Significance

  • Represent India’s strongest public enterprises
  • Ensure leadership in globally competitive sectors
  • Help India achieve economic sovereignty
  • Major contributors to national infrastructure

Navratna Significance

  • Bridge the gap between Miniratna and Maharatna
  • Maintain industrial stability
  • Promote efficient management practices
  • Expand India’s sectoral capacity

Miniratna Significance

  • Encourage smaller PSUs to grow
  • Improve operational efficiency
  • Support local economies
  • Provide employment and industrial expansion

Also Read: Mutual Funds

Maharatna, Navratna, and Miniratna Financial Contributions

These PSUs collectively contribute major revenue, profits, and capital investments to India’s economy each year.

  • CPSUs earned revenue above ₹24 lakh crore in 2018-19
  • Top 10 profit-making PSUs earned ₹1.60 lakh crore profit in 2021-22
  • ONGC alone generated ₹40,305 crore profit
  • Maharatna and Navratna companies account for the largest share of national industrial investment
  • Miniratnas contribute significantly to regional economies

Maharatna, Navratna, and Miniratna Recent Development

The government is revising the classification system to improve PSU performance and align with Vision 2047.

  • A new proposal suggests adding two more Ratna categories.
  • A 10-member committee led by Cabinet Secretary T. V. Somanathan will review performance standards.
  • New criteria include corporate governance, leadership development, capital expenditure, sustainability, and dividend payout.
  • The revision aims to modernize public sector enterprises for global competitiveness.
  • This aligns PSU growth with India’s long-term development strategy under Vision 2047.

Maharatna, Navratna, and Miniratna List

As of 2025, India has 14 Maharatna, 26 Navratna, and 74 Miniratna companies (Category I and II combined). These companies together form the backbone of India’s industrial and economic strength.

Maharatna Companies

Maharatnas include India’s biggest companies like ONGC, NTPC, IOCL, Coal India, and Power Grid. The Maharatna consists of 14 companies as of now-

  1. Oil and Natural Gas Corporation (ONGC)
  2. Bharat Heavy Electricals Limited (BHEL)
  3. Bharat Petroleum Corporation Limited (BPCL)
  4. Coal India Limited (CIL)
  5. Gas Authority of India Limited (GAIL)
  6. Hindustan Petroleum Corporation Limited (HPCL)
  7. Indian Oil Corporation Limited (IOCL)
  8. National Thermal Power Corporation (NTPC)
  9. Power Grid Corporation of India (PGCIL)
  10. Power Finance Corporation Limited (PFCL)
  11. Rural Electrification Corporation Limited (REC)
  12. Steel Authority of India Limited (SAIL)
  13. Oil India Limited (OIL)
  14. Hindustan Aeronautics Limited (HAL) (since 12 October 2024)

Navratna Companies

Navratnas include leading sectoral enterprises such as BEL, Hindustan Aeronautics Limited (HAL), and Engineers India Limited. The list of 26 Navratnas are:

  1. Bharat Electronics Limited (BEL)
  2. Container Corporation of India (CONCOR)
  3. Engineers India Limited (EIL)
  4. Mahanagar Telephone Nigam Limited (MTNL)
  5. National Aluminium Company (NALCO)
  6. NBCC (India) Limited
  7. National Mineral Development Corporation (NMDC)
  8. NLC India Limited (Neyveli Lignite)
  9. Rashtriya Ispat Nigam Limited (RINL)
  10. Shipping Corporation of India (SCI)
  11. Rail Vikas Nigam Limited (RVNL)
  12. ONGC Videsh Limited
  13. Rashtriya Chemicals & Fertilizers Limited (RCF)
  14. Ircon International
  15. RITES Limited
  16. National Fertilizers Limited (NFL)
  17. Housing And Urban Development Corporation Limited (HUDCO)
  18. Indian Renewable Energy Development Agency (IREDA)
  19. Central Warehousing Corporation (CWC)
  20. Mazagon Dockyard Limited
  21. RailTel Corporation of India Limited (RCIL) (since 30 August 2024)
  22. SJVN Limited
  23. NHPC Limited
  24. Solar Energy Corporation of India (SECI)
  25. Indian Railway Catering and Tourism Corporation (IRCTC)
  26. Indian Railway Finance Corporation (IRFC)

Miniratna Companies

Miniratnas include both large and regionally important PSUs spread across energy, services, transport, minerals, manufacturing, and engineering sectors. The major companies under Miniratna Category has been listed below:

Miniratna Category-I

  1. Airports Authority of India
  2. Antrix Corporation Limited
  3. Balmer Lawrie & Co. Limited
  4. Bharat Coking Coal Limited
  5. Bharat Dynamics Limited
  6. BEML Limited
  7. Bharat Sanchar Nigam Limited
  8. Bridge & Roof Company (India) Limited
  9. Central Warehousing Corporation
  10. Central Coalfields Limited
  11. Central Mine Planning & Design Institute Limited
  12. Chennai Petroleum Corporation Limited
  13. Cochin Shipyard Limited
  14. EdCIL (India) Limited
  15. Kamarajar Port Limited
  16. Garden Reach Shipbuilders & Engineers Limited
  17. Goa Shipyard Limited
  18. Hindustan Copper Limited
  19. HLL Lifecare Limited
  20. Hindustan Newsprint Limited
  21. Hindustan Paper Corporation Limited
  22. Housing & Urban Development Corporation Limited
  23. HSCC (India) Limited
  24. India Tourism Development Corporation Limited
  25. Indian Rare Earths Limited
  26. Indian Railway Catering & Tourism Corporation Limited
  27. Indian Railway Finance Corporation Limited
  28. Indian Renewable Energy Development Agency Limited
  29. India Trade Promotion Organization
  30. IRCON International Limited
  31. KIOCL Limited
  32. Mazagaon Dock Shipbuilders Limited
  33. Mahanadi Coalfields Limited
  34. MOIL Limited
  35. Mangalore Refinery & Petrochemical Limited
  36. Mineral Exploration Corporation Limited
  37. Mishra Dhatu Nigam Limited
  38. MMTC Limited
  39. MSTC Limited
  40. National Fertilizers Limited
  41. National Projects Construction Corporation Limited
  42. National Small Industries Corporation Limited
  43. National Seeds Corporation
  44. NHPC Limited
  45. Northern Coalfields Limited
  46. North Eastern Electric Power Corporation Limited
  47. Numaligarh Refinery Limited
  48. ONGC Videsh Limited
  49. Pawan Hans Helicopters Limited
  50. Projects & Development India Limited
  51. Railtel Corporation of India Limited
  52. Rail Vikas Nigam Limited
  53. Rashtriya Chemicals & Fertilizers Limited
  54. RITES Limited
  55. SJVN Limited
  56. Security Printing and Minting Corporation of India Limited
  57. South Eastern Coalfields Limited
  58. Telecommunications Consultants India Limited
  59. THDC India Limited
  60. Western Coalfields Limited
  61. WAPCOS Limited

Miniratna Category-II

  1. Artificial Limbs Manufacturing Corporation of India
  2. Bharat Pumps & Compressors Limited
  3. Broadcast Engineering Consultants India Limited
  4. Central Railside Warehouse Company Limited
  5. Engineering Projects (India) Limited
  6. FCI Aravali Gypsum & Minerals India Limited
  7. Ferro Scrap Nigam Limited
  8. HMT (International) Limited
  9. Indian Medicines & Pharmaceuticals Corporation Limited
  10. MECON Limited
  11. National Film Development Corporation Limited
  12. Rajasthan Electronics & Instruments Limited

Maharatna, Navratna, and Miniratna UPSC

Maharatna, Navratna, and Miniratna classifications highlight the government’s strategy of empowering its strongest enterprises while encouraging others to grow. They ensure that PSUs remain globally competitive, financially strong, and strategically important for national development. Maharatnas drive large-scale national growth, Navratnas enhance sectoral performance, and Miniratnas strengthen regional and foundational industries. Together, they contribute significantly to revenue, employment, capital formation, and infrastructure. As India moves towards Vision 2047, strengthening these categories will help create modern, efficient, and future-ready public sector enterprises that support India’s economic progress.

Maharatna, Navratna, and Miniratna FAQs

Q1: What are Maharatna, Navratna, and Miniratna companies?

Ans: These are categories of top-performing Central Public Sector Enterprises (CPSEs) in India, classified based on their financial strength, autonomy, and strategic importance.

Q2: Which companies get Maharatna status?

Ans: Maharatna status is awarded to very large CPSEs with high annual turnover, profitability, and global presence, such as ONGC, Indian Oil, and NTPC.

Q3: What is the main difference between Navratna and Miniratna companies?

Ans: Navratna companies enjoy greater financial autonomy than Miniratna companies, while Miniratna are divided into Category I and II based on consistent profit-making records.

Q4: How does a company become a Navratna?

Ans: A CPSE becomes Navratna by meeting specific performance criteria, including strong financials and a high score in parameters like profitability, net worth, and operational efficiency.

Q5: Why are the classification of Maharatna, Navratna, and Miniratna important?

Ans: These categories allow CPSEs greater independence in investment decisions, helping them expand operations, compete globally, and improve efficiency without seeking constant government approval.

UPSC Daily Quiz 1 May 2026

UPSC Daily Quiz

[WpProQuiz 151]

UPSC Daily Quiz FAQs

Q1: What is the Daily UPSC Quiz?

Ans: The Daily UPSC Quiz is a set of practice questions based on current affairs, static subjects, and PYQs that help aspirants enhance retention and test conceptual clarity regularly.

Q2: How is the Daily Quiz useful for UPSC preparation?

Ans: Daily quizzes support learning, help in revision, improve time management, and boost accuracy for both UPSC Prelims and Mains through consistent practice.

Q3: Are the quiz questions based on the UPSC syllabus?

Ans: Yes, all questions are aligned with the UPSC Syllabus 2025, covering key areas like Polity, Economy, Environment, History, Geography, and Current Affairs.

Q4: Are solutions and explanations provided with the quiz?

Ans: Yes, each quiz includes detailed explanations and source references to enhance conceptual understanding and enable self-assessment.

Q5: Is the Daily UPSC Quiz suitable for both Prelims and Mains?

Ans: Primarily focused on Prelims (MCQ format), but it also indirectly helps in Mains by strengthening subject knowledge and factual clarity.

Women and Men in India 2025 Report, Key Findings, Challenges

Women and Men in India 2025 Report

Ministry of Statistics and Programme Implementation (MoSPI) has released the 27th edition of its publication titled “Women and Men in India 2025: Selected Indicators and Data” at the National Deliberative Summit on “Data for Development”, on 29th April 2026 at Bhubaneswar, Odisha.

Key Findings of the Women and Men in India 2025 Report

The Women and Men in India 2025 Report provides a comprehensive, evidence-based overview of gender-related trends across population, health, education, employment, and decision-making. It compiles gender-disaggregated data from multiple ministries, departments, and organisations.

Population:

  • The average annual exponential population growth rate in India follows an inverted U- shaped trajectory, implying that population growth accelerated in the decades after independence, reached its peak during the 1971–1981 decade, steadily declining thereafter.
  • The slowing growth rate signals the onset of a demographic dividend phase, which over time, may lead towards population ageing.
  • The sex ratio at birth has increased at the all-India level, indicating improved survival of women and girls reaching from 904 in 2017-19 to 917 in 2021-23.
  • As of 2023, highest sex ratio is in northeastern states of Arunachal Pradesh, where women outnumber men with a sex ratio of 1085, followed by Nagaland (1007), followed by Goa (973). The worst performing are Jharkhand (899) and Bihar (900).

Health: 

  • The Total Fertility Rate in urban areas has shown a decline between 2019 to 2023.
  • Maternal Mortality Ratio has shown a steady and significant decline over the years, with the maternal mortality ratio reducing from 254 to 88 from 2004-06 to 2021-23
  • Infant mortality rates have declined consistently for both girls and boys between 2008 and 2023.
  • Across rural and urban areas, the mean age at marriage for women has shown a steady increase from 2021 onwards.
  • Female sterilization emerges as the most commonly adopted method of family planning among currently married women aged 15-49, accounting for 37.9 percent of total usage.
  • Mizoram emerges as the most affected state with respect to HIV infections for both male and female together, recording a prevalence rate of 1.02 and 0.77 respectively, whereas Kerala report the lowest prevalence, at 0.01 for males and 0.01 for females.
  • Tuberculosis cases are observed to be more prevalent among the male population compared to females.

Education: 

  • Literacy rates have improved for both genders across urban and rural areas.
  • Gross Enrolment Ratio (GER) at Higher Education has improved from 28.5 to 30.2 for females and 28.3 to 28.9 for males between 2021-22 and 2022-23.
  • Gender parity has been achieved across all levels of school education from Primary to Higher Secondary level.
  • The dropout rates for both girls and boys have decreased from the year 2022-23 to 2024-25 under NEP Structure.
  • As of 2022-23, the Mean Year of Schooling (MYS) in formal education, in India is 8.4 for 15 years and above, while the female MYS is 7.4, making it 1.9 years lesser than male MYS.
  • Thirty out of Thirty-six States/Union Territories have Gender Parity Index of 1.00 and above.
  • More females study Arts, Sciences, Social Sciences and Medical Sciences as compared to males. Whereas, more males study Engineering & Technology, IT & Computers, Management and Law as compared to females.

Participation in Economy:

  • Rural females have seen the highest increase in Labour Force Participation Rate (LFPR), going from 37.5 to 45.9 during the period 2022 to 2025.
  • In year 2025, the Worker Population Ratio (WPR) for ages 15 and above is 76.6 for males and 38.8 for females. For both genders, the WPR is higher in rural areas compared to urban areas.
  • As of 2025, there is a greater concentration of women workers in agriculture in rural areas, with nearly three-fourths (72.7 per cent) of rural female workers engaged in this sector. In contrast, in urban areas, women workers are more concentrated in manufacturing activities.
  • Unemployment remains most pronounced among the youth population aged 15–29 years, with its severity being particularly high in urban areas.
  • Average time spent in a day by males on unpaid activities has increased between 2019 and 2024, whereas average time spent in a day by female on paid activities increased in the same period.
  • The average time spent by men on unpaid domestic services is 88 minutes while women spent 289 minutes.

Participation in Decision Making: 

  • As of 2025, women constitute 13.65 per cent of Members of Parliament, and 9.86 per cent hold ministerial portfolios.
  • Women account for 49.75 per cent of elected Panchayat representatives where 16 States report more than 50 per cent women’s representation in Panchayati Raj Institutions.
  • Representation of women in PRIs is the highest in Assam (60.1%), followed by Dadar & Nagar Haveli and Daman & Diu (56.93%), and Chhattisgarh (56.5%)
  • The gender gap in percentage of Male and Female Electors Voting has progressively narrowed, with female turnout surpassing male turnout in the 2019 and 2024 General Election.
  • Of the 1,122 approved judicial positions, only 118 are held by women, accounting for just 14.30% of the judiciary. In the Supreme Court, women constitute merely 3.03% of the permanent strength of 33 judges
  • The defence sector, including the army and navy, has seen a rise in the number of women serving from 2020 and 2025.
  • There has been a 73.80% increase in Men engaged in managerial positions between 2017 and 2025, whereas there has been a 102.54% increase in Women engaged in managerial positions during the same time period
  • Women’s participation in household decision-making has seen a marked improvement, as, at least 16 out of 28 States and 6 out of 8 Union Territories report more than 90 per cent of women participating in household decision-making as of 2019-21.

Violence against Women and other challenges: 

  • Crimes Against Women constitute 7.18% of total crimes committed in year 2023.
  • West Bengal reported the highest share (19.24 %), of reported Crimes Against Women to total crimes within state.
  • Cybercrime against women has expanded rapidly with the growth of ICTs and digital platforms. Registered cases increased from 4,242 in 2017 to 19,510 in 2023, with cyber pornography and cyber stalking/bullying most frequently reported; Karnataka (7,002) recorded the highest number of cases, followed by Maharashtra (2,502) and Uttarakhand (1,463).
  • A noted decline is observed between 2015-16 to 2019-21 in Child Marriage.
  • The number of suicides has increased for men, women, and transgender persons from 2018 to 2023.

Key Challenges

  • Persistent son preference affecting sex ratio at birth
  • Low female workforce participation in urban areas
  • Dominance of informal and unpaid work among women
  • Gender wage gap and limited asset ownership
  • Underrepresentation in top political and corporate leadership
  • Heavy burden of unpaid care work

Way Forward

  • Strengthen enforcement of laws against gender discrimination and sex-selective practices
  • Promote creation of quality and formal employment opportunities for women
  • Enhance skill development, digital inclusion, and access to entrepreneurship
  • Provide institutional support systems such as childcare and social security
  • Encourage greater representation of women in leadership and governance roles
  • Improve collection and utilisation of gender-disaggregated data for targeted policy design

Women and Men in India 2025 Report FAQs

Q1: Who released the Women and Men in India 2025 Report?

Ans: Ministry of Statistics and Programme Implementation (MoSPI) released the Women and Men in India 2025 Report, presenting gender-disaggregated data across sectors such as population, health, education, employment, and decision-making.

Q2: When and where was the Women and Men in India 2025 Report released?

Ans: The Women and Men in India 2025 Report was released on 29 April 2026 at the National Deliberative Summit on “Data for Development” held in Bhubaneswar, Odisha.

Q3: What is the objective of the Women and Men in India 2025 Report?

Ans: The Women and Men in India 2025 Report aims to provide a comprehensive statistical foundation for understanding gender dynamics in India and to support evidence-based, gender-responsive policymaking. survival at birth, although it remains below the natural level.

Q4: What does the Women and Men in India 2025 Report indicate about infant mortality rates?

Ans: According to the Women and Men in India 2025 Report, infant mortality rates have declined consistently for both girls and boys between 2008 and 2023, reflecting improvements in healthcare services and reduced gender disparities in survival outcomes.

Q5: What are the findings of the Women and Men in India 2025 Report on education?

Ans: The Women and Men in India 2025 Report shows that gender parity has been achieved across all levels of school education, and female participation in higher education has increased, with the Gross Enrolment Ratio rising from 28.5 to 30.2.

Bangladesh Liberation War 1971, Reason, History, Timeline

Bangladesh Liberation War 1971

The Bangladesh Liberation War 1971 was a major armed conflict in South Asia that led to the birth of Bangladesh as an independent nation. It was fought from 26 March 1971 to 16 December 1971. This war emerged from political discrimination, economic exploitation, cultural suppression and military violence in East Pakistan. The conflict transformed regional geopolitics, involved India and Pakistan directly and caused one of the largest humanitarian crises of the twentieth century.

Bangladesh Liberation War 1971

The Bangladesh Liberation War 1971 was rooted in decades of inequality between East Pakistan and West Pakistan after the creation of Pakistan in 1947. Although both regions formed one country, they were divided by nearly 1,600 km of Indian territory, and had different languages, cultures, economies and political priorities.

The war permanently changed the geopolitical map of South Asia and established Bangladesh as a sovereign nation after decades of inequality and violence.

Bangladesh Liberation War 1971 Historical Background

The Bangladesh Liberation War 1971 Timeline has been detailed below:

  • Partition of Bengal 1905: The British partitioned Bengal in 1905 on religious lines, deepening Hindu-Muslim political divisions. This event shaped Muslim political mobilisation and later influenced the formation of separate Muslim political identity in eastern Bengal.
  • Creation of Pakistan in 1947: British India was partitioned in 1947, creating Pakistan with West Pakistan and East Pakistan. Despite being one country, the two wings were geographically separated and culturally distinct.
  • Demographic imbalance: East Pakistan had a larger population than West Pakistan, but political power remained concentrated in western provinces, particularly among Punjabi and military elites.
  • Language conflict of 1948: In 1948, Muhammad Ali Jinnah declared Urdu as Pakistan’s sole national language. Bengali speaking East Pakistan strongly opposed this decision because Bengali was spoken by the majority.
  • Language Movement 1952: Student protests in Dhaka against Urdu imposition intensified in February 1952. Police firing killed several students on 21 February 1952, making it a historic day later recognised as International Mother Language Day by UNESCO.
  • Cultural suppression: Bengali culture faced marginalisation. Traditional Bengali identity, literature, music and symbols were viewed suspiciously by West Pakistani rulers. The works of Rabindranath Tagore were restricted.
  • 1954 provincial election: The Awami League gained major support in East Pakistan. However, the central government repeatedly undermined democratic authority in the eastern wing.
  • Constitution of 1956: Pakistan became the Islamic Republic of Pakistan in 1956. Although East Pakistan got formal representation, actual control remained with military and bureaucratic elites in the west.
  • Military coup of 1958: General Mohammad Ayub Khan took power in 1958. His rule increased centralisation and widened economic inequalities between East and West Pakistan.
  • Economic exploitation: East Pakistan produced major export goods such as jute, Pakistan’s largest foreign exchange earner. However, much of the revenue was spent in West Pakistan.
  • Underrepresentation in state institutions: Bengalis remained underrepresented in the military, civil administration and foreign policy structures despite forming a large share of the population.
  • Six Point Movement 1966: Sheikh Mujibur Rahman introduced the Six Points in 1966 demanding autonomy for East Pakistan. These included separate currency arrangements, fiscal control, trade independence and regional military structure.
  • Agartala Conspiracy Case 1968: Mujibur Rahman was accused of conspiring with India for secession. The case increased his popularity among Bengalis.
  • Yahya Khan’s rule 1969: General Yahya Khan replaced Ayub Khan in 1969 and promised elections, but his administration remained dominated by West Pakistan.
  • Bhola Cyclone 1970: The cyclone killed around 300,000 to 500,000 people in East Pakistan. Poor central government relief deepened Bengali anger.
  • 1970 General Elections: The Awami League won 167 out of 169 East Pakistan seats and secured majority in Pakistan’s National Assembly, giving Sheikh Mujibur Rahman the right to form government.
  • Denial of democratic transfer: Zulfikar Ali Bhutto and Yahya Khan refused to transfer power to Mujib, triggering widespread protests and civil disobedience.
  • Historic 7 March Speech: On 7 March 1971, Sheikh Mujibur Rahman delivered his famous speech at Dhaka Race Course Ground, preparing Bengalis for resistance.
  • First Bangladesh flag raising: On 23 March 1971, the flag of Bangladesh was publicly raised, symbolising the move toward independence.
  • Beginning of repression: Political talks collapsed by late March, leading directly to military action and the start of the Bangladesh Liberation War 1971.

Bangladesh Liberation War 1971 Reasons

The Bangladesh Liberation War 1971 began because East Pakistan’s people faced sustained political exclusion, economic discrimination and cultural suppression. The major causes of the war has been discussed here:

  • Political exclusion: Despite majority population, Bengalis lacked real political influence. Decision making remained dominated by West Pakistan’s military bureaucratic structure.
  • Economic disparity: East Pakistan generated major export earnings through jute, yet development investment remained concentrated in West Pakistan.
  • Language discrimination: Urdu imposition ignored Bengali identity and created early resistance.
  • Cultural hostility: Bengali dress, literature and social identity were often treated as weak Islamic markers by western rulers.
  • Military underrepresentation: Bengalis had low representation in Pakistan Army and administration.
  • Autonomy demands ignored: The Six Point Programme was rejected by the central government.
  • Bhola Cyclone neglect: Failure to provide adequate relief increased anti state sentiment.
  • Election denial: Awami League’s 1970 democratic mandate was blocked.
  • Operation Searchlight: Military crackdown directly transformed political conflict into war.
  • Mass refugee crisis: Millions fled to India, internationalising the conflict.
  • Rise of Bengali nationalism: Shared language and identity created a strong liberation movement.
  • Indian strategic interests: India sought to reduce two front military threat and manage refugee pressure.
  • Cold War alignment: The Indo-Soviet Treaty of August 1971 strengthened India’s position.
  • Humanitarian catastrophe: Atrocities created global pressure and resistance.

Bangladesh Liberation War 1971 Events

The major events that took place during the Bangladesh Liberation War 1971 has been highlighted below:

  • Political crisis and mass mobilisation (March 1971): On 1 March 1971, President Yahya Khan postponed the National Assembly session, denying power to the Awami League. This triggered widespread protests, civil disobedience and administrative paralysis across East Pakistan. On 7 March, Sheikh Mujibur Rahman delivered his historic speech at Dhaka, effectively calling for resistance and preparing the population for independence.
  • Operation Searchlight and declaration of independence (25-26 March 1971): On the night of 25 March, the Pakistan Army launched Operation Searchlight, targeting Dhaka University, intellectuals, students and civilians using heavy weapons. Mass killings began immediately. In the early hours of 26 March, Sheikh Mujibur Rahman declared independence before being arrested and taken to West Pakistan. This marked the formal beginning of the Bangladesh Liberation War 1971.
  • Spread of violence and early resistance (late March-April 1971): Following the crackdown, widespread massacres occurred in places like Chittagong, Rangpur and Syedpur. Bengali soldiers, police and civilians began organised resistance. Major Ziaur Rahman announced independence from Chittagong on behalf of Mujib, strengthening morale. Large numbers of civilians began fleeing to India due to escalating violence.
  • Formation of government in exile and command structure (April 1971): On 10 April, Awami League leaders formed a provisional government in exile, formally sworn in on 17 April at Mujibnagar. Tajuddin Ahmad became Prime Minister, while M. A. G. Osmani was appointed Commander in Chief, organising the resistance into sectors.
  • Rise of Mukti Bahini and guerrilla warfare (April-June 1971): The Mukti Bahini emerged as the main resistance force, consisting of defected soldiers, students and civilians. Guerrilla tactics such as ambushes, sabotage and intelligence operations weakened Pakistani positions. India began providing training camps, arms and logistical support along the border, strengthening the insurgency.
  • Mass atrocities and humanitarian crisis (May-August 1971): Pakistani forces and allied militias carried out systematic massacres, including the Chuknagar and Jinjira killings. Sexual violence affected an estimated 200,000-400,000 women. US diplomat Archer Blood sent the “Blood Telegram,” describing a “reign of terror.” By mid 1971, around 10-15 million refugees had fled into India.
  • International awareness and cultural mobilisation (mid 1971): The Swadhin Bangla Betar Kendra broadcast resistance messages, while global awareness increased through diplomatic channels and media. On 1 August 1971, George Harrison and Ravi Shankar organised the Concert for Bangladesh in New York, raising funds and international sympathy.
  • Strategic alignment and Indo-Soviet Treaty (August 1971): India signed the Indo-Soviet Treaty of Peace, Friendship and Cooperation with the Soviet Union, securing diplomatic backing against possible US or Chinese intervention. This agreement strengthened India’s position and ensured strategic balance during the conflict.
  • Expansion of guerrilla operations and military organisation (July-November 1971): The Mukti Bahini intensified operations through coordinated attacks like Operation Jackpot, targeting ports, communication lines and supply chains. Bangladesh’s naval and air units began limited operations. Sector commanders coordinated resistance, weakening Pakistani administrative and military control across rural regions.
  • Escalation into full scale India-Pakistan war (3 December 1971): Pakistan launched Operation Chengiz Khan, carrying out pre-emptive air strikes on Indian airbases in the western sector. In response, India formally entered the war on both eastern and western fronts, transforming the Bangladesh Liberation War 1971 into a full scale interstate conflict.
  • Rapid Indian advance and key battles (December 1971): Indian forces, in coordination with Mukti Bahini, achieved swift victories in battles such as Garibpur, Hilli and Dhalai. The Tangail airdrop cut off Pakistani retreat routes, while the Meghna heli bridge operation enabled rapid troop movement. Indian Navy established dominance in the Bay of Bengal, isolating East Pakistan.
  • Recognition of Bangladesh and fall of Dhaka (December 1971): On 6 December, India officially recognised Bangladesh as an independent state. Indian and Bangladeshi forces advanced rapidly toward Dhaka, capturing key towns and cutting supply lines, making Pakistani defence unsustainable.
  • Surrender and end of war (16 December 1971): On 16 December, A. A. K. Niazi signed the Instrument of Surrender before Jagjit Singh Aurora in Dhaka. Around 93,000 Pakistani troops surrendered, marking the end of the Bangladesh Liberation War 1971 and the birth of an independent Bangladesh.

Bangladesh Liberation War 1971 Consequences

The Bangladesh Liberation War 1971 changed South Asia’s political structure and created Bangladesh. The war had deep humanitarian, diplomatic and military consequences.

  • Creation of Bangladesh (December 1971): East Pakistan officially became the independent People’s Republic of Bangladesh..
  • Humanitarian crisis aftermath (late 1971-early 1972): The war left between 300,000 and 3,000,000 dead, with tens of millions displaced and around 10-15 million refugees returning from India, creating immediate rehabilitation and reconstruction challenges.
  • Recognition of war survivors (1972): The Bangladesh government honoured women subjected to sexual violence as Birangona and initiated rehabilitation programs, acknowledging the suffering of an estimated 200,000 to 400,000 survivors.
  • Bihari refugee crisis (early 1970s): Many Bihari muhajirs faced violence and displacement for alleged collaboration with Pakistan, with hundreds of thousands placed in camps and many remaining as “stranded Pakistanis” for decades.
  • Shimla Agreement (2 July 1972): India and Pakistan signed this agreement to normalise relations, return captured territory, repatriate prisoners of war and commit to peaceful resolution of disputes including Kashmir.
  • Shift in regional power balance (1970s): India emerged as a dominant military and political power in South Asia, while Pakistan faced strategic and psychological setbacks after losing its eastern wing.
  • India-Bangladesh Relations (post 1971): Strong bilateral ties developed, with Bangladesh becoming an important regional partner for trade, connectivity and security cooperation.
  • End of two front threat for India: The separation of East Pakistan removed the strategic risk of simultaneous eastern and western attacks on India in future conflicts.
  • Global recognition of Bangladesh (1972 onwards): Many countries gradually recognised Bangladesh as an independent state, strengthening its international legitimacy.

Bangladesh Liberation War 1971 Leaders

The Bangladesh Liberation War 1971 was shaped by political, military and diplomatic leadership across Bangladesh, India and Pakistan.

  • Sheikh Mujibur Rahman: Leader of the Awami League who declared independence on 26 March 1971 and mobilised mass support for autonomy through the Six Point Movement, becoming the central symbol of Bengali nationalism.
  • Tajuddin Ahmad: Prime Minister of the provisional government who organised administration in exile, coordinated international support and ensured effective functioning of resistance leadership during the war.
  • M. A. G. Osmani: Commander in Chief of Bangladesh Forces who structured the Mukti Bahini into organised sectors and led coordinated guerrilla warfare against Pakistani military forces.
  • Ziaur Rahman: Military officer who announced independence from Chittagong on behalf of Mujibur Rahman and played an active operational role in resistance efforts.
  • Indira Gandhi: Prime Minister of India who provided diplomatic backing, mobilised global opinion, supported refugees and authorised military intervention in December 1971.
  • Jagjit Singh Aurora: Indian Eastern Command chief who led the final military campaign in East Pakistan and accepted the Instrument of Surrender on 16 December 1971.
  • Sam Manekshaw: Chief of Army Staff of India who planned and executed military strategy, ensuring coordinated operations across eastern and western fronts.
  • Yahya Khan: President of Pakistan who ordered Operation Searchlight and directed military suppression of Bengali movement, leading to escalation into full scale war.
  • Zulfikar Ali Bhutto: Political leader of West Pakistan who opposed transfer of power to Mujibur Rahman after 1970 elections, contributing to political deadlock.
  • A. A. K. Niazi: Commander of Pakistan Eastern Command who led Pakistani forces in East Pakistan and signed the Instrument of Surrender before Indian and Bangladeshi forces.
  • Archer Blood: United States diplomat in Dhaka who highlighted atrocities through the “Blood Telegram,” bringing international attention to human rights violations.
  • George Harrison and Ravi Shankar: Organised the Concert for Bangladesh in August 1971, raising global awareness and humanitarian support for war victims.

Bangladesh Liberation War 1971 FAQs

Q1: When did the Bangladesh Liberation War 1971 begin and end?

Ans: The war started on 26 March 1971 and ended on 16 December 1971 with the surrender of Pakistani forces.

Q2: What was the main cause of the Bangladesh Liberation War 1971?

Ans: The war was mainly caused by political discrimination, economic inequality, cultural suppression and denial of democratic rights to East Pakistan.

Q3: What was Operation Searchlight?

Ans: Operation Searchlight was a military crackdown launched by Pakistan on 25 March 1971 to suppress the Bengali independence movement.

Q4: What role did India play in the Bangladesh Liberation War 1971?

Ans: India supported the Mukti Bahini with training and later directly intervened militarily, leading to Pakistan’s defeat.

Q5: What was the outcome of the Bangladesh Liberation War 1971?

Ans: The war resulted in the creation of Bangladesh as an independent nation after Pakistan’s surrender on 16 December 1971.

National Vector Borne Disease Control Programme (NVBDCP)

National Vector Borne Disease Control Programme

The National Vector Borne Disease Control Programme (NVBDCP) is a centrally sponsored scheme of the Government of India aimed at preventing and controlling major vector-borne diseases. It operates under the National Health Mission (NHM) and is implemented by the Directorate of NVBDCP under the Ministry of Health and Family Welfare.

The programme covers major diseases such as malaria, dengue, chikungunya, Japanese encephalitis, kala-azar, and lymphatic filariasis. It focuses on surveillance, early diagnosis, treatment, and vector control to reduce illness and deaths across the country.

What are Vector-Borne Diseases?

Vector-borne diseases are illnesses caused by pathogens such as viruses, bacteria, or parasites that are transmitted to humans through vectors like mosquitoes, ticks, and fleas. These diseases are common in tropical regions and can lead to serious health complications if not prevented or treated in time.

  • Transmitted through vectors like mosquitoes, sandflies, ticks, and fleas
  • Caused by viruses, bacteria, or parasites
  • Spread through bites of infected vectors
  • Common in tropical and subtropical regions
  • Examples: Malaria, Dengue, Chikungunya, Japanese Encephalitis, Kala-azar
  • Can lead to severe illness or death if untreated

Major Sub-Programmes under NVBDCP

The Major Sub-Programmes under the National Vector Borne Disease Control Programme (NVBDCP) focus on controlling and eliminating key vector-borne diseases through targeted interventions. These programmes have been highlighted below in brief.

1. Kala-azar Control Programme

Kala-azar (Visceral Leishmaniasis) is a serious parasitic disease transmitted by the bite of infected female sandflies.

  • Endemic mainly in Bihar, Jharkhand, West Bengal, and eastern Uttar Pradesh, with a high burden in rural and poor communities
  • Caused by Leishmania donovani parasite affecting internal organs like liver and spleen
  • Focus on early case detection through active surveillance and rapid diagnostic kits
  • Ensures complete and free treatment using effective drugs such as Amphotericin-B
  • Implementation of Indoor Residual Spraying (IRS) to kill sandflies
  • Distribution of Long-Lasting Insecticidal Nets (LLINs) in endemic areas
  • Strong emphasis on vector habitat reduction and sanitation improvements
  • Regional collaboration through agreements with neighboring countries for elimination
  • Target: Reduce incidence to <1 case per 10,000 population at block level

2. National Filaria Control Programme (NFCP)

Lymphatic Filariasis is a chronic mosquito-borne disease that can lead to permanent disability such as elephantiasis.

  • One of the oldest public health programmes, launched in 1955
  • Caused mainly by Wuchereria bancrofti and Brugia malayi parasites
  • Transmitted by mosquito species like Culex, Anopheles, and Mansonia
  • Implementation of Mass Drug Administration (MDA) using DEC and Albendazole to entire at-risk population
  • Introduction of triple-drug therapy (IDA) in select districts to accelerate elimination
  • Focus on morbidity management and disability prevention (MMDP) for affected individuals
  • Anti-larval measures and vector control in urban and rural areas
  • Regular monitoring of microfilaria rate through night blood surveys
  • Target: Elimination of Lymphatic Filariasis as a public health problem

3. Japanese Encephalitis (JE) Control Programme

Japanese Encephalitis is a viral brain infection transmitted by Culex mosquitoes and maintained in animal reservoirs.

  • A zoonotic disease, with pigs and water birds acting as amplifying hosts
  • High prevalence in rural and agricultural regions, especially rice-growing areas
  • Focus on vaccination campaigns, particularly for children in endemic districts
  • Strengthening surveillance systems for early detection of outbreaks
  • Establishment of specialized treatment facilities and pediatric ICUs
  • Vector control through fogging, larval control, and environmental management
  • Public awareness regarding safe animal rearing practices and sanitation
  • Emphasis on case management to reduce fatality rates
  • Continuous monitoring by central and state health authorities

4. National Anti-Malaria Programme

Malaria is a life-threatening disease caused by Plasmodium parasites and transmitted by female Anopheles mosquitoes.

  • Focus on high-burden districts and tribal areas where transmission is high
  • Distribution of Long-Lasting Insecticidal Nets (LLINs) to vulnerable populations
  • Use of Rapid Diagnostic Tests (RDTs) for quick and accurate detection
  • Treatment using Artemisinin-based Combination Therapy (ACT)
  • Indoor Residual Spraying (IRS) in high-risk areas
  • Seasonal malaria chemoprevention in selected regions
  • Strengthening surveillance through real-time reporting systems
  • Community awareness on prevention and early treatment
  • Goal: Eliminate malaria by 2027 with phased reduction strategy

5. Dengue Control Programme

Dengue is a fast-spreading viral disease transmitted by Aedes mosquitoes that breed in clean stagnant water.

  • Strong correlation with urbanization and monsoon season
  • Focus on source reduction by eliminating breeding sites like water containers, coolers, and tyres
  • Promotion of weekly dry day to prevent water stagnation
  • Community-based campaigns for behavior change and awareness
  • Strengthening of laboratory diagnosis using ELISA and NS1 tests
  • Training healthcare workers for clinical management of severe dengue cases
  • Emergency response measures during outbreaks, including fogging and spraying
  • Coordination with municipal bodies for sanitation and waste management
  • Aim: Reduce incidence and prevent outbreaks through proactive measures

6. Chikungunya Control Programme

Chikungunya is a viral disease characterized by fever and severe joint pain, transmitted by Aedes mosquitoes.

  • Common in urban and semi-urban areas, often occurring alongside dengue outbreaks
  • No specific antiviral treatment; focus is on symptomatic relief (pain and fever management)
  • Prevention through vector control and elimination of breeding sites
  • Public awareness campaigns on personal protection and sanitation practices
  • Surveillance to monitor spread and seasonal trends
  • Strengthening diagnostic facilities for early identification
  • Integration with dengue control activities for better efficiency
  • Focus on reducing disease burden and improving quality of life for affected individuals

Strategies Adopted Under NVBDCP

The National Vector Borne Disease Control Programme follows a comprehensive and integrated approach to prevent and control vector-borne diseases through medical, environmental, and community-based strategies.

  • Emphasis on Integrated Vector Management (IVM) using a mix of biological, chemical, and environmental methods for effective and sustainable control
  • Disease surveillance systems including active, passive, and sentinel surveillance for early detection and timely response to outbreaks
  • Early diagnosis and prompt treatment through rapid diagnostic tests and free treatment facilities to reduce complications and deaths
  • Implementation of vector control measures such as indoor residual spraying and distribution of insecticide-treated bed nets
  • Focus on environmental management by eliminating stagnant water, improving sanitation, and reducing mosquito breeding sites
  • Use of biological control methods like larvivorous fish and eco-friendly agents to control mosquito larvae
  • Application of chemical control measures such as larvicides and fogging during outbreaks to reduce vector population
  • Promotion of community participation and awareness through health education and public involvement in prevention practices
  • Adoption of behaviour change communication (BCC) to encourage long-term preventive habits among people
  • Strengthening healthcare infrastructure and capacity building through training of health workers and improving diagnostic facilities
  • Ensuring intersectoral coordination among different departments like health, sanitation, and urban development
  • Special interventions like vaccination for Japanese Encephalitis and Mass Drug Administration for Lymphatic Filariasis to target specific diseases

Achievements of NVBDCP

The National Vector Borne Disease Control Programme has made significant progress in reducing the burden of major vector-borne diseases through improved surveillance, treatment, and prevention strategies.

  • Significant reduction in malaria cases and deaths over the past decades
  • Around 70-80% decline in malaria mortality compared to earlier baseline levels
  • Nearly 97% reduction in Kala-azar cases since the 1990s in endemic regions
  • Improved coverage of Mass Drug Administration (MDA) for Lymphatic Filariasis
  • Decline in microfilaria rates, indicating progress towards elimination
  • Strengthened disease surveillance and reporting systems across states
  • Expansion of diagnostic and treatment facilities in rural and urban areas
  • Increased public awareness and community participation in vector control
  • Progress towards malaria elimination target by 2027
  • Better intersectoral coordination for disease prevention and control

National Vector Borne Disease Control Programme FAQs

Q1: What is the National Vector Borne Disease Control Programme (NVBDCP)?

Ans: It is a centrally sponsored programme launched in 2003 by the Government of India to prevent and control major vector-borne diseases through surveillance, treatment, and vector control strategies.

Q2: Which diseases are covered under NVBDCP?

Ans: The programme covers six diseases: Malaria, Dengue, Chikungunya, Japanese Encephalitis, Kala-azar, and Lymphatic Filariasis.

Q3: Under which ministry is NVBDCP implemented?

Ans: It is implemented by the Ministry of Health and Family Welfare under the National Health Mission.

Q4: What is the main objective of NVBDCP?

Ans: The main objective is to reduce morbidity and mortality caused by vector-borne diseases and move towards their elimination.

Q5: What are vector-borne diseases?

Ans: These are diseases transmitted to humans through vectors like mosquitoes, sandflies, ticks, and fleas carrying infectious pathogens.

NITI Aayog Report on City Governance, Moving Towards Effective City Government

NITI Aayog Report on City Governance

India is undergoing rapid urbanisation, with cities emerging as the primary engines of economic growth, innovation, and employment generation. As India moves towards the vision of Viksit Bharat 2047 and a $30 trillion economy, the role of cities becomes central to national transformation.

However, the potential of urban centres remains constrained by structural challenges in urban governance, including fragmented institutions, weak fiscal autonomy, and limited administrative capacity.

In this context, the NITI Aayog report titled “Moving Towards Effective City Government – A Framework for Million-plus Cities” provides a comprehensive roadmap for strengthening urban local governance in India.

Million-Plus Cities: Focus of the Report

The NITI Ayog report on City Governance focuses on million-plus cities, which are urban agglomerations with a population of one million or more

  • These cities are critical because, although they represent a limited number of urban centres, they account for a disproportionately large share of Gross Domestic Product (GDP), industrial activity, and service sector growth.
  • They also function as major hubs of internal migration, attracting labour from rural and semi-urban areas. 
  • Due to their scale, density, and complexity, these cities require advanced systems of urban governance, stronger institutions, and greater financial and administrative autonomy.

Strengthening governance in these cities is therefore seen as a high-impact entry point for improving overall urban development in India.

Core Objective of the Niti Ayog Report on City Governance 

The NITI Ayog Report on City Governance titled “Moving Towards Effective City Government – A Framework for Million-plus Cities” focuses on transforming urban local bodies into effective city governments capable of functioning as integrated governance units. Its central idea is to strengthen:

  • Institutional capacity
  • Fiscal autonomy
  • Functional clarity

The emphasis is on treating cities not merely as service providers but as economic governance units driving urban transformation. However, the realisation of this vision is constrained by several deep-rooted structural and institutional challenges in urban governance.

Key Challenges in Urban Governance

The key constraints highlighted by the NITI Ayog on City Governance report include: 

Limited Devolution of Functions: 

Fragmented Institutional Framework: 

  • Urban governance is characterised by multiple overlapping agencies such as municipal corporations, development authorities, and parastatal bodies. This fragmentation leads to duplication of functions, lack of coordination, and diffusion of accountability.

Weak City Leadership: Most urban local bodies lack empowered and stable executive leadership. 

  • Mayors are generally not directly elected and lack executive and financial authority. Their tenure varies across states, and real decision-making power rests with municipal commissioners or committees, leading to weak accountability and fragmented urban governance.

Fiscal Constraints: Urban local bodies face persistent fiscal stress due to weak own-source revenues, inadequate transfers, and dependence on tied grants.

  • Key issues include poor property tax collection, reluctance to impose user charges, and unpredictable state transfers, compounded by weak implementation of State Finance Commissions.
  • This weak fiscal base limits access to capital markets such as municipal bonds and constrains long-term infrastructure investment.

Inadequate Human Resources and Capacity Constraints: Urban local bodies face significant shortages of skilled personnel in areas such as urban planning, engineering, finance, and project management. Key constraints include:

  • High dependence on deputation from state services
  • Frequent transfer of municipal commissioners, affecting continuity
  • Lack of professional municipal cadres
  • Limited training and skill development opportunities

These constraints weaken institutional capacity for effective project planning, procurement, revenue collection, and contract management.

Key Recommendations of the Report

Strengthening Urban Political Leadership: The report recommends the introduction of a directly elected mayor with a fixed tenure. This mayor should be supported by a mayor-in-council system to ensure collective decision-making and administrative continuity.

Integration of Urban Service Delivery: Core urban services such as water supply, sanitation, solid waste management, and urban transport should be consolidated under city governments. This integration is intended to reduce institutional fragmentation and improve accountability in service delivery.

Strengthening Municipal Finances: The report emphasises strengthening the fiscal base of urban local bodies through:

  • Expansion of own source revenue
  • Improvement in property tax assessment and collection
  • Strengthening the role of State Finance Commissions
  • Development of municipal bond markets to enable access to capital funding

Institutional Rationalisation: The report recommends bringing various parastatal agencies involved in urban development under the oversight or coordination of city governments. This is intended to ensure institutional coherence and improve governance efficiency.

Implementation Strategy

The NITI Ayog report on City Governance report proposes a phased and incremental approach to reform implementation. It suggests that:

  • States undertake necessary amendments to their municipal legislation
  • The Ministry of Housing and Urban Affairs revise the Model Municipal Law
  • Pilot reforms be implemented in selected million-plus cities
  • Successful models be scaled across urban centres based on evaluation and learning

This approach reflects the principle of cooperative federalism, where both the central and state governments collaborate in institutional reform.

NITI Aayog Report on City Governance FAQs

Q1: What is the core objective of NITI Ayog report on City Governance titled “Moving Towards Effective City Government – A Framework for Million-plus Cities?

Ans: To transform urban local bodies into effective city governments with stronger institutions, finances, and functional clarity.

Q2: What are million-plus cities in the NITI Aayog report?

Ans: Million-plus cities are urban agglomerations with a population of one million or more, which contribute significantly to GDP, jobs, and migration-driven urbanisation.

Q3: What are the major governance challenges identified in urban local bodies?

Ans: The key challenges include limited devolution of functions, fragmented institutional structures, weak leadership at the city level, fiscal constraints, and inadequate human resources and administrative capacity.

Q4: What are the key recommendations of the NITI Aayog report on city governance?

Ans: The report recommends strengthening urban governance through a directly elected mayor with executive authority, integration of key urban services under city governments, enhancement of municipal finances via own-source revenues and municipal bonds, and integration of parastatal agencies under municipal control, implemented through phased state-led reforms.

Q5: What is the significance of the NITI Aayog report on city governance?

Ans: It provides a comprehensive framework to strengthen urban governance by empowering city governments, improving service delivery, enhancing fiscal autonomy, and enabling cities to function as key drivers of economic growth and development.

Aurangzeb Tomb, Location, Architecture, Sufi Influence

Aurangzeb Tomb

The Tomb of Aurangzeb is one of the most historically significant yet uniquely modest Mughal monuments in India. Located in the quiet town of Khuldabad near the famous Ellora Caves, this tomb stands in stark contrast to the grand mausoleums of other Mughal emperors.

Aurangzeb Tomb

The tomb of Aurangzeb in Khuldabad is a simple, open-air grave reflecting his wish for a modest and humble burial.

  • Location: Situated in Khuldabad, near Ellora Caves.
  • Architecture: Plain, unadorned structure with no grand dome or decoration.
  • Sufi Influence: Built following traditions of the Chishti Order.
  • Historical Fact: Aurangzeb died in 1707 in Ahmednagar and was buried here.
  • Renovation: Later enclosed and maintained during the time of Lord Curzon.
  • Uniqueness: One of the simplest tombs among Mughal emperors.

About Aurangzeb

Aurangzeb (Abul Muzaffar Muhi-ud-Din Muhammad Aurangzeb Alamgir) was the sixth Mughal Emperor who ruled India from 1658 to 1707. Under his reign, the Mughal Empire reached its greatest territorial extent, but his policies also contributed to its gradual decline.

  • Reign & Expansion: Ruled for nearly 50 years (1658-1707), the longest among Mughal emperors, expanding the empire across most of the Indian subcontinent.
  • Family Background: Son of Shah Jahan and Mumtaz Mahal; part of the prestigious Mughal dynasty.
  • War of Succession: Captured the throne after defeating his brother Dara Shikoh in the Battle of Samugarh.
  • Administrative Ability: Known for strong central administration, strict governance, and emphasis on law and order based on Islamic principles.
  • Religious Policies: Reimposed Jizya tax on non-Muslims (1679); followed orthodox Sunni Islam, though also issued grants to some Hindu temples.
  • Deccan Campaigns: Annexed Bijapur (1686) and Golconda (1687); spent years in the Deccan fighting the Marathas.
  • Conflicts with Regional Powers: Faced resistance from leaders like Shivaji and Sambhaji, weakening Mughal control.
  • Rajput Relations: Strained ties with Rajputs, especially in Mewar and Marwar, reducing earlier alliances built by Akbar.
  • Sikh Policy: Ordered execution of Guru Tegh Bahadur, leading to strong opposition from Guru Gobind Singh.
  • Economic Impact: Continuous warfare, especially in the Deccan, drained the empire’s treasury and administrative efficiency.
  • Death & Burial: Died in 1707 in Ahmednagar and was buried in a simple grave at Khuldabad, reflecting his personal austerity.
  • Legacy: Remembered as a powerful yet controversial ruler—his expansion strengthened the empire temporarily, but his policies contributed to its long-term decline.

Aurangzeb Tomb FAQs

Q1: Where is the tomb of Aurangzeb located?

Ans: It is located in Khuldabad, near the famous Ellora Caves.

Q2: When did Aurangzeb die?

Ans: He died in 1707 in Ahmednagar after ruling the Mughal Empire for nearly 50 years.

Q3: What is unique about Aurangzeb’s tomb?

Ans: Unlike other Mughal tombs, it is an open-air grave with minimal decoration, reflecting humility and Sufi influence.

Q4: Which architectural tradition influenced the tomb?

Ans: The tomb follows the principles of the Chishti Order, emphasizing simplicity.

Fascism, Meaning, Features, Types and Consequences

Fascism

Fascism is an authoritarian and ultra-nationalist political ideology that emerged in early 20th-century Europe, primarily associated with regimes led by Benito Mussolini in Italy and Adolf Hitler in Germany. The term originates from the Italian word fascio, meaning a bundle or group, symbolizing unity and strength through collective identity.

Fascism places the nation above individual interests and promotes a centralized, dictatorial government led by a single powerful leader. It rejects liberal democracy, political pluralism, and often suppresses dissent through censorship, propaganda, and violence. Fascist regimes typically emphasize militarism, expansionism, and strict social control.

Fascism Features

Fascism is characterized by a set of defining features that distinguish it from other political ideologies:

  • Extreme Nationalism: Fascism promotes intense pride in the nation, often accompanied by the belief in national superiority and cultural purity.
  • Authoritarian Leadership: Power is concentrated in a single leader who exercises absolute control over the state and its institutions.
  • Suppression of Opposition: Political dissent is not tolerated; opposition parties, free press, and civil liberties are often eliminated.
  • Militarism: Fascist states prioritize military strength, expansion, and discipline, often glorifying war as a means of national growth.
  • Propaganda and Censorship: Governments control media and communication to influence public opinion and maintain authority.
  • Anti-Democratic Nature: Fascism rejects democratic principles like free elections, rule of law, and individual rights.
  • Economic Control: While allowing private property, fascist regimes regulate industries to serve national interests.
  • Cult of Personality: Leaders are portrayed as heroic figures, creatinsg unquestioned loyalty among citizens.
  • Social Control: Strict regulation of society, including education, culture, and personal freedoms, is enforced to maintain uniformity.

Fascism Types

Although fascism shares common characteristics, it has taken different forms in various countries:

  • Italian Fascism: Founded by Benito Mussolini, this form emphasized corporatism, state control, and national unity. It was the original model of fascism.
  • German Nazism: Developed under Adolf Hitler, Nazism combined fascist ideology with racial theories, anti-Semitism, and expansionist ambitions.
  • Spanish Falangism: Led by Francisco Franco, this version incorporated elements of fascism with conservative and nationalist traditions in Spain.
  • Clerical Fascism: A blend of fascist ideology with religious institutions, seen in some European regimes where the church supported authoritarian governance.
  • Neo-Fascism: Modern adaptations of fascist ideology that exist in some extremist political movements today, often focusing on nationalism and anti-immigration sentiments.

Consequences of Fascism

The rise and implementation of fascism had profound and often catastrophic consequences:

  • Global Conflict: Fascist expansionism directly contributed to World War II, one of the deadliest wars in history.
  • Human Rights Violations: Millions suffered under fascist regimes due to repression, forced labor, and genocidal policies such as the Holocaust.
  • Destruction of Democracy: Democratic institutions were dismantled, leading to long-term political instability.
  • Economic Disruption: Although some short-term economic recovery occurred, long-term effects included war devastation and resource depletion.
  • Social Division: Fascism fostered hatred, discrimination, and division based on race, religion, and ideology.
  • Loss of Freedom: Citizens lived under constant surveillance, censorship, and fear, with limited personal liberties.

Fascism FAQs

Q1: What is fascism?

Ans: Fascism is an authoritarian political ideology that emphasizes extreme nationalism, centralized power under a single leader, and suppression of opposition and individual freedoms.

Q2: Who founded fascism?

Ans: Fascism was founded by Benito Mussolini in Italy in the early 20th century.

Q3: What are the main features of fascism?

Ans: Key features include ultra-nationalism, dictatorial leadership, censorship, militarism, suppression of dissent, and rejection of democracy.

Q4: How is fascism different from democracy?

Ans: Fascism concentrates power in one leader and restricts freedoms, whereas democracy ensures power to the people through elections, rule of law, and protection of rights.

Q5: Is Nazism a type of fascism?

Ans: Yes, Nazism led by Adolf Hitler is a form of fascism that includes racial ideology and anti-Semitism.

Human Development Index (HDI), Meaning, Calculation, Components

The Human Development Index (HDI) is a key measure developed by the United Nations Development Programme (UNDP) that shifts the focus of development from purely economic output to people’s capacities and lives. It provides a more holistic view of how countries are doing in terms of health, education and standard of living.

Human Development Index (HDI)

The Human Development Index is a summary measure of average achievement in three basic dimensions of human development:

  • A long and healthy life (measured by life expectancy at birth)
  • Access to knowledge (measured by expected years of schooling for children and mean years of schooling for adults)
  • A decent standard of living (measured by Gross National Income (GNI) per capita, adjusted for purchasing-power parity)

In effect, the HDI uses the geometric mean of these three dimension-indices to compute a composite score between 0 and 1, where a higher number indicates higher human development.

Human Development Index Calculation

The Human Development Index 2025 is calculated in three steps:

  • Compute Dimension Indices
    • Health Index = (Life Expectancy - 20) / (85 -20)
    • Education Index = (Mean Years of Schooling Index + Expected Years of Schooling Index) / 2
    • Income Index = (log(GNI per capita) - log(100)) / (log(75,000) - log(100))
  • Combine Indices
    • HDI = (Health Index × Education Index × Income Index)^(1/3)
  • Rank Countries
    • Countries are ranked based on their HDI score and grouped into development categories.

Human Development Index Historical Background

The idea of measuring development through people’s well-being, rather than only economic output, gained importance in the late 20th century. The United Nations Development Programme (UNDP) introduced the Human Development Index (HDI) in 1990, inspired by the works of Dr. Mahbub ul Haq and Amartya Sen. Dr. Haq argued that development should expand people’s choices and freedoms, not just increase national income. The first Human Development Report published in 1990 introduced HDI as a new approach to understanding development, focusing on health, knowledge, and income as key pillars.

Since then, the HDI has become a central feature of UNDP’s annual Human Development Reports (HDRs) and is used by governments, economists, and researchers worldwide to evaluate progress and inequalities among countries.

Human Development Index Classification of Countries

The United Nations Development Programme (UNDP) categorizes countries into four groups based on HDI values:

  • Very High Human Development: HDI of 0.800 and above
  • High Human Development: HDI between 0.700 and 0.799
  • Medium Human Development: HDI between 0.550 and 0.699
  • Low Human Development: HDI below 0.550

Human Development Index Components

The major dimensions of the Human Development Index is distributed into three components as given below:

  1. Health Dimension
    • Represented by life expectancy at birth, which reflects the average number of years a person is expected to live under current conditions.
    • Higher life expectancy indicates better health services, nutrition, and living conditions.
  2. Education Dimension
    • Measured using mean years of schooling (average years of education received by adults aged 25 and above) and expected years of schooling (years of schooling a child entering the education system can expect).
    • Education enhances human capabilities and contributes to individual and national growth.
  3. Standard of Living
    • Measured by Gross National Income (GNI) per capita (PPP), adjusted for purchasing power parity to reflect real living standards.
    • This captures the economic capacity and access to resources available to citizens.

Inequality Adjusted Human Development Index (IHDI)

The Inequality-Adjusted Human Development Index (IHDI) shows how unequal access to opportunities lowers overall development. For India, the IHDI shows nearly 31% loss in HDI value due to inequality in income, health, and education. The Gender Development Index (GDI) and Gender Inequality Index (GII) highlight gender-based disparities:

  • India ranked 108th on GII (UNDP 2024).
  • Women’s labor participation rate is below 30%.
  • Access to higher education and political representation still needs improvement.

Human Development Index India’s Performance

India’s experience with the Human Development Index offers interesting insights:

  • According to UNDP, India’s HDI value rose from 0.676 in 2022 to 0.685 in 2023, placing the country at 130th out of 193 countries in the 2025 Human Development Report.
  • Between 1990 and 2022, India’s HDI value increased from 0.434 to 0.644, a rise of about 48.4%.
  • The improvement has been driven by gains in life expectancy (from 58.6 years in 1990 to around 72 years in 2023), education (schooling years increasing) and income (GNI per capita rising).
  • Life expectancy: Increased from 58.6 years (1990) to 72 years (2023).
  • Education: Mean years of schooling rose from 3.0 years to 6.2 years.
  • Income: GNI per capita (PPP) increased from US$2,000 in 1990 to about US$9,000 in 2023.
  • Despite these gains, India still falls under the Medium Human Development category.
  • States like Kerala, Goa, and Himachal Pradesh show higher HDI, while Bihar, Uttar Pradesh, and Jharkhand lag behind.

Government Policies to Improve HDI in India

India has introduced several national programs to improve its HDI indicators. Together, these schemes aim to raise living standards and human capital, both essential for improving the Human Development Index.

  • Ayushman Bharat Yojana (2018): Provides free healthcare coverage to over 10 crore families.
  • National Education Policy (2020): Focuses on inclusive, skill-based, and flexible education.
  • Skill India Mission (2015): Aims to provide vocational training to millions of youth.
  • PM-KISAN and PM Awas Yojana: Support rural income and housing.
  • Beti Bachao Beti Padhao (2015): Promotes education and safety of girls.
  • Digital India Mission: Expands access to technology and e-governance, improving service delivery.

UNDP Indices

To overcome Human Development Index’s limitations, UNDP introduced related indices:

  • Inequality-adjusted HDI (IHDI)- Adjusts HDI based on inequality levels in each dimension.
  • Gender Development Index (GDI)- Compares HDI values for men and women.
  • Gender Inequality Index (GII)- Measures gender-based disadvantages in health, empowerment, and labor.
  • Multidimensional Poverty Index (MPI)- Measures overlapping deprivations in health, education, and living standards.

Human Development Index Challenges

While the HDI is a powerful tool, there are well-recognised limitations:

  • Simplification: It condenses complex realities into a single number, which can mask internal disparities and context.
  • Data Lag and Quality: Some critics argue that HDI data may be outdated or not fully represent the current situation, particularly in countries with rapid change.
  • Exclusion of Important Dimensions: HDI does not directly capture environmental sustainability, governance quality, informal work, and the distribution of development. Although complementary indices exist, they are not always emphasised.
  • Comparability Issues: Methodological changes over time, and differing national circumstances, complicate direct comparisons across years or countries.

Way Forward:

  • Focus on Quality Education: Mere enrolment is not sufficient; improving learning outcomes and mean years of schooling should be a priority.
  • Health Equity: Strengthening primary health-care networks, reducing malnutrition, and improving maternal and child health will push life-expectancy gains further.
  • Growth with Inclusivity: Economic growth must translate into improved living standards for marginalised communities for the standard-of-living dimension to keep rising.
  • Addressing Inequality: Losses in HDI due to inequality suggest that targeted programmes for vulnerable groups (women, rural, SC/ST, minorities) will deliver better human development.
  • State-Level Variation: Sub-national HDI shows vast gaps between Indian states (for example, Goa or Kerala perform much better than others), policy must recognise regional diversity.
  • Beyond HDI: Integrate sustainability and climate resilience into human development planning, as climate change increasingly threatens human life and well-being.

Human Development Index Significance

While Gross Domestic Product (GDP) and per capita income remain important, they don’t tell the full story about human welfare. The HDI matters because:

  • It highlights people’s opportunities, not just their income or output.
  • It allows cross-country comparison and shows broader social progress.
  • It directs attention to education, health and standard of living as core development components.
  • It enables policy makers to identify weak areas (for example schooling or income) and design targeted interventions.

Human Development Index Future Aspects

As India and the world navigate 21st-century challenges, the Human Development Index remains relevant but requires evolution:

  • Technological Change: The UNDP’s 2025 Report emphasises how AI and digital inclusion can shape future human development opportunities.
  • Climate and Environment: Human development must increasingly account for environmental resilience, because climate vulnerabilities affect health, livelihood and education.
  • Data Disaggregation: More granularity at district and city-level HDI, and inclusion of informal work and technology access, will improve relevance.
  • Inclusive Growth: The focus will shift to not just raising HDI values but ensuring equitable and sustainable human development.
  • Global Interdependence: India’s progress in HDI ties into global goals like the Sustainable Development Goal 10 (reduced inequalities) and SDG 3, 4 (health and education).

Human Development Index UPSC

The Human Development Index reveals important global trends:

  • Worldwide, HDI values have steadily increased since its introduction in 1990.
  • The HDI emphasises that human well-being is more than economic growth—it encompasses health, education and living standards.
  • The index has also been complemented by related measures such as the Inequality-adjusted HDI (IHDI), Gender Development Index (GDI) and Multidimensional Poverty Index (MPI) to account for uneven distribution of development.
  • In policy discourse, the HDI has shifted the paradigm from “how much economy grows” to “how well people live”.

Human Development Index FAQs

Q1: What is the Human Development Index (HDI)?

Ans: The Human Development Index (HDI) is a composite measure developed by UNDP in 1990 to assess health, education, and income levels in countries.

Q2: Who introduced the Human Development Index?

Ans: HDI was introduced by economist Dr. Mahbub ul Haq and Nobel Laureate Amartya Sen in 1990 through the United Nations Development Programme (UNDP).

Q3: What is India’s rank in the Human Development Index 2024?

Ans: According to the UNDP Human Development Report 2024, India ranks 134th with an HDI value of 0.644.

Q4: What are the three main components of Human Development Index?

Ans: The three main components of HDI are life expectancy at birth, mean and expected years of schooling, and Gross National Income per capita.

Q5: How is the Human Development Index different from GDP?

Ans: GDP measures only economic output, while HDI assesses overall human well-being by combining health, education, and income indicators.

Samudragupta, History, Empire, Coinage, Napoleon of India 

Samudragupta

Samudragupta was a powerful Gupta ruler who expanded the empire and strengthened Indian political unity. He ruled from about 330 to 380 CE and is seen as an ideal king of ancient India. He combined military strength with cultural excellence and laid the foundation of a prosperous imperial system. His achievements in warfare, administration and culture made the Samudragupta era a defining phase of early Indian history.

Samudragupta

Samudragupta was born into the Gupta dynasty to Chandragupta I. He was the second emperor of the dynasty and became one of the greatest emperors of ancient India.

  • Parentage: Samudragupta was the son of Chandragupta I and the Licchavi princess Kumaradevi, which strengthened his political legitimacy through both Gupta and Licchavi lineages.
  • Accession: He was chosen as successor by his father due to his qualities like courage, intelligence and leadership, even though other princes may have contested the throne.
  • Early Struggles: After ascending the throne, Samudragupta faced revolts and opposition which he successfully suppressed, consolidating his authority in the initial phase of his reign.
  • Personality: He was described as a warrior with numerous battle scars, symbolizing his participation in many wars and his personal bravery on the battlefield.
  • Talents: Samudragupta was not only a conqueror but also a poet and musician, earning the title “Kaviraja” and being depicted playing the Veena on coins.
  • Religious Inclination: He was a devout follower of Hinduism, especially devoted to Vishnu, yet showed tolerance towards other religions including Buddhism.
  • Family: His son Chandragupta II succeeded him and continued his expansionist policies, further strengthening the empire.
  • Title “Napoleon of India”: Historian V. A. Smith gave Samudragupta this title due to his extensive military campaigns, rapid conquests and unmatched ability to defeat numerous kings across northern and southern India.

Samudragupta Empire

Samudragupta built a vast empire through continuous conquests and political strategies, making his rule a turning point in Indian history.

  • Time Period: He ruled approximately from 335/336 CE to 375/380 CE, marking a significant phase in the rise of the Gupta Empire.
  • Extent of Empire: Samudragupta’s empire extended from the Brahmaputra River in the east to the Yamuna and Chambal in the west and from the Himalayan foothills to the Narmada River, covering fertile and densely populated regions.
  • Core Regions: The central territories included the Ganga valley, which formed the economic and political heartland of Samudragupta’s rule, ensuring stability and strong administrative control over major cities and trade routes.
  • Tributary States: Frontier regions like Assam, Nepal, eastern Bengal and parts of Punjab accepted his authority and paid tribute, maintaining local autonomy while acknowledging Samudragupta’s supremacy.
  • Southern Policy: After defeating southern kings like Vishnugopa of Kanchipuram, Samudragupta restored them to power as tributaries, showing a flexible approach toward distant territories.
  • Northern Annexations: Several northern rulers were defeated and their territories directly annexed into the empire, strengthening centralized authority and expanding territorial boundaries.

Administration under Samudragupta

Samudragupta maintained an efficient administrative system that ensured peace and prosperity across his vast empire.

  • Central Authority: The king held supreme authority and supervised all administrative functions, ensuring effective governance and control over distant regions through trusted officials.
  • Provincial Administration: Provinces enjoyed limited autonomy but remained under central supervision, helping maintain local efficiency while ensuring loyalty to the emperor.
  • Officials and Governance: Administrative officers were appointed to manage revenue, law and order, ensuring smooth functioning of the state machinery across the empire.
  • Military Control: A strong military system supported governance, preventing rebellions and maintaining internal security throughout Samudragupta’s reign.

Economy under Samudragupta

The economy during Samudragupta’s reign was prosperous, supported by agriculture, trade and advanced coinage systems.

  • Agricultural Base: Fertile regions of the Ganga valley ensured high agricultural output, forming the backbone of the empire’s economy and supporting a large population.
  • Trade and Commerce: Internal and external trade flourished due to political stability and control over key trade routes connecting different parts of the subcontinent.
  • Gold Coinage: Samudragupta issued high quality gold coins with excellent craftsmanship, reflecting economic strength and advanced metallurgical knowledge.
  • Types of Coins: Coins included Garuda type, Ashvamedha type and Veena playing type, each representing political achievements, religious rituals and cultural interests.
  • Influence of Kushans: The coinage system adopted features from Kushan models, including weight standards and designs, showing continuity and adaptation in economic practices.

Art and Architecture under Samudragupta

Art and cultural expression flourished under Samudragupta, reflecting the intellectual richness of his reign.

  • Patron of Literature: Samudragupta was known as Kaviraj due to his skills in Sanskrit poetry, showing his deep interest in literature and intellectual pursuits.
  • Court Scholars: His court included notable scholars like Harisena, who composed the Prayag Prashasti, providing valuable historical information about his reign.
  • Musical Talent: Coins depict Samudragupta playing the Veena, highlighting his abilities as a musician and his patronage of performing arts.
  • Religious Architecture: He allowed construction of a Buddhist monastery at Bodh Gaya for the king of Ceylon, showing support for religious institutions.
  • Cultural Growth: His reign saw a blend of art, literature and philosophy, contributing to the cultural richness of the Gupta period.

Society and Culture under Samudragupta

Society during Samudragupta’s time was structured yet culturally vibrant, influenced by religious and social developments.

  • Brahmanical Influence: The period saw the strengthening of Brahmanism as a social and religious system, influencing social practices and hierarchy.
  • Caste System: The Gupta rulers supported caste distinctions, which became more organized and influential in shaping social structure.
  • Religious Tolerance: Despite being devoted to Vishnu, Samudragupta showed tolerance toward other religions, including Buddhism.
  • Ashvamedha Yajna: He performed the Ashvamedha sacrifice to assert imperial authority and revive Vedic traditions, enhancing his political legitimacy.
  • Cultural Integration: Interaction between regions through conquests and diplomacy promoted cultural exchange and unity across the empire.

Campaigns of Samudragupta

Samudragupta conducted extensive military campaigns that established his reputation as a great conqueror.

  • Aryavarta Campaign: He defeated several northern kings and annexed their territories, strengthening the core region of his empire.
  • Dakshinapatha Campaign: In the south, he defeated 12 rulers including those of Kosala, Kanchi and Vengi, but restored them as tributaries.
  • Atavika States: Forest kingdoms were subdued and brought under control, ensuring security and expansion into central India.
  • Frontier States: Regions like Assam, Nepal and Rajasthan accepted his authority and paid tribute, extending his influence beyond direct control.
  • Military Achievements: He fought numerous battles, defeated 9 northern kings, subjugated 12 southern rulers and earned the title of an undefeated conqueror.

Samudragupta FAQs

Q1: Who was Samudragupta?

Ans: Samudragupta was a Gupta emperor who ruled from about 330 to 380 CE and greatly expanded his empire.

Q2: Why is Samudragupta called the Napoleon of India?

Ans: He is called the Napoleon of India due to his extensive military campaigns and successful conquests across northern and southern regions.

Q3: What is the Prayag Prashasti?

Ans: Prayag Prashasti is an inscription on the Allahabad Pillar written by Harisena describing Samudragupta’s achievements and conquests.

Q4: What were the main achievements of Samudragupta?

Ans: His major achievements include vast territorial expansion, strong administration, issuance of gold coins and promotion of art and culture.

Q5: Who succeeded Samudragupta?

Ans: Samudragupta was succeeded by his son Chandragupta II, who further strengthened the Gupta Empire.

Past Risk and Return Verification Agency (PaRRVA)

Past Risk and Return Verification Agency (PaRRVA)

Past Risk and Return Verification Agency (PaRRVA) Latest News

Recently, the Securities and Exchange Board of India (SEBI) has operationalised the Past Risk and Return Verification Agency (PaRRVA).

About Past Risk and Return Verification Agency (PaRRVA)

  • It is a regulatory initiative designed to bring transparency and standardization to performance claims made by financial intermediaries.
  • It has been operationalised by the Securities and Exchange Board of India (SEBI)
  • Designated Entities: CARE Ratings Limited has been granted recognition as the PaRRVA and the National Stock Exchange of India Limited (NSE) will function as the PaRRVA Data Centre (PDC).
  • The following entities can Use PaRRVA
    • Investment Advisers (IA)
    • Research Analysts (RA)
    • Trading Members (TM)
    • Investors seeking verified performance data
  • Features
    • It will enable regulated entities such as investment advisers, research analysts, and algorithmic trading service providers to showcase their verified performance.
    • It will enable investors to access reliable and standardised data for informed decision-making.
    • Additionally, regulated entities will be permitted to use PaRRVA-verified performance in their advertisements, in line with SEBI’s regulatory provisions.
    • It ensures that all risk-return metrics presented to investors are independently verified and compliant with SEBI guidelines.

Source: News on Air

Past Risk and Return Verification Agency (PaRRVA) FAQs

Q1: PaRRVA was proposed by which regulator?

Ans: SEBI

Q2: What does PaRRVA stand for?

Ans: Past Risk and Return Verification Agency

Peacock Tarantula

Peacock Tarantula

Peacock Tarantula Latest News

A scientific survey to assess the Peacock Tarantula has begun at Nagarjunasagar Srisailam Tiger Reserve in Andhra Pradesh.

About Peacock Tarantula

  • It is one of the rarest and most visually striking spiders in the world, famous for its metallic blue coloration.
  • It is also known as the Gooty Sapphire Ornamental Tarantula, named after the region where it was first discovered.
  • Appearance
    • The spider has a distinctive bright blue body with yellow and white markings, forming geometric patterns on its legs and abdomen.
    • It can grow up to 6–8 inches in leg span, making it a large and impressive spider.
  • Habitat: In its natural habitat, it is an arboreal species, meaning it lives on trees, occupying tree holes, bark crevices, and elevated surfaces.
  • Distribution: It is endemic to India, primarily found in parts of Andhra Pradesh.

Characteristics of Peacock Tarantula

  • It is a nocturnal hunter, remaining hidden during the day and becoming active at night.
  • It is an active predator that does not rely on webs but instead uses speed and venom to capture prey such as insects and small animals.
  • It is known for being fast and agile, it can move quickly and climb vertical surfaces with ease.
  • Females have a long lifespan (up to 15 years), while males have a shorter life cycle.
  • During reproduction, females lay egg sacs containing around 50–150 eggs, which they guard until hatching.
  • Conservation Status: IUCN: Critically Endangered
  • Threats: The main threats it faces come from habitat loss due to logging, firewood collection, and forest degradation.
  • Ecological Role: It plays an important ecological role by controlling insect populations and supporting biodiversity.

Source: TH

Peacock Tarantula FAQs

Q1: What is the IUCN Red List status of Peacock Tarantula?

Ans: Critically Endangered

Q2: Peacock Tarantula is endemic to which state in India?

Ans: Andhra Pradesh

International Labour Day 2026

International Labour Day 2026

International Labour Day Latest News

Every year, International Labour Day, also known as May Day, is celebrated on May 1 across the world.

About International Labour Day (ILD)

  • International Labour Day, also known as May Day, is observed annually on May 1 to honor the dedication and contributions of workers across the globe.
  • It is a memorial to the labor movement’s struggles and victories.
  • History:
    • The origins of ILD trace back to the late 19th century when 400,000 workers across the USA organised a peaceful strike in Chicago on 1st May 1886. 
    • They were protesting to demand an eight-hour workday. 
    • Unfortunately, the strike turned violent, and several unarmed workers were killed by the police.  
    • It came to be known as the Haymarket Affair and was a turning point in the struggle for workers' rights.
    • This turning point stimulated trade unions and socialist federations across Europe to declare May 1 an international day of workers’ solidarity, formally approved in 1889 at the Paris meeting of the Second International.
  • While International Labour Day commemorates events in the United States, both the US and Canada observe Labour Day on the first Monday of September, not May 1.
  • Over 80 countries, including India, Cuba, and China, mark ILD.
  • In India, the first Labour Day celebration was held in Chennai (then Madras) in 1923 by the Labour Kisan Party of Hindustan.
    • Malayapuram Singaravelu Chettiar, the leader, raised the red flag for the first time in India and demanded that the government declare May 1 a national holiday to recognise workers' rights. 
  • The day usually involves parades, union gatherings, and celebrations that emphasize employee rights.
  • May Day 2026 Theme: This year, the International Labour Organisation (ILO) selected the theme for May Day 2026 as: “Ensuring a Healthy Psychosocial Working Environment."

Source: NDTV

International Labour Day FAQs

Q1: When is International Labour Day celebrated every year

Ans: It is celebrated annually on May 1.

Q2: What historical event led to the origin of International Labour Day?

Ans: The Haymarket Affair in Chicago in 1886 led to its origin.

Q3: When was Labour Day first celebrated in India?

Ans: In India, the first Labour Day celebration was held in Chennai (then Madras) in 1923 by the Labour Kisan Party of Hindustan.

Q4: What is the theme of International Labour Day 2026?

Ans: The theme is “Ensuring a Healthy Psychosocial Working Environment.”

Kotgarh Wildlife Sanctuary

Kotgarh Wildlife Sanctuary

Kotgarh Wildlife Sanctuary Latest News

Forest officials recently arrested four suspected poachers from the Baliguda forest division of the Kotgarh wildlife sanctuary in Kandhamal.

About Kotgarh Wildlife Sanctuary

  • It is located in the Kandhamal district of Odisha.
  • It’s classified as a moist deciduous forest in the Eastern Highlands. 
  • Spanning an area of 399.5 sq.km., the sanctuary is surrounded by lush hills and dense forests.
  • The sanctuary is home to 52 tribal settlements, including Kutia Kondh and Desia Kondh.  
  • Vegetation: The sanctuary’s principal vegetation is dense, damp deciduous forests with meadows. 
  • Flora:
    • Sal, Piasal, Sisoo, Kendu, Gamhar, Asan, Kusum, Harida, Bahada, Amala, Mango, Tamarind, Mahua, Jackfruit, Randhan, Kangada, Jamun, Salapo, Bheru, Arjun, Char, Dhaura, and Kochila are among the prevalent flora. 
    • Many rare and endangered medicinal plants exist, including Abutilon Indicum, Cissus quadrangularis, Crateva Magna, Cycas sphaerica, etc.
  • Fauna
    • Tigers, elephants, Gaur, Sambar deer, Spotted deer, Peafowl, Red jungle fowl, Blackbuck, Leopard, Sloth bear, Chital, and various bird and reptile species, including rare species like Forsten's cat snake (Boiga forsteni), can all be found in this sanctuary.  
    • The sanctuary’s major attraction is the Chousingha, or four-horned antelope.

Source: TOI

Kotgarh Wildlife Sanctuary FAQs

Q1: Where is Kotgarh Wildlife Sanctuary located?

Ans: It is located in the Kandhamal district of Odisha.

Q2: What type of forest characterizes Kotgarh Wildlife Sanctuary?

Ans: It is classified as a moist deciduous forest in the Eastern Highlands.

Q3: Which tribal communities inhabit Kotgarh Wildlife Sanctuary?

Ans: It is home to tribes such as the Kutia Kondh and Desia Kondh.

Ru-Soam Bridges

Ru-Soam Bridges

Ru-Soam Bridges Latest News

UNESCO has partnered with the Sikkim government to document the indigenous engineering known as Ru-Soam.

About Ru-Soam Bridges

  • It is a cane bridge built by the Lepcha community in Sikkim, especially in the Khangchendzonga Biosphere Reserve.
  • In the Lepcha language, ‘Ru’ means cane or rattan, while ‘Soam’ refers to a bridge.
  • Materials Used: It is crafted from locally available materials such as bamboo, cane, and wood.
  • Structural Features
    • It consists of two parallel canes called soamgyang. The soamgyang are tied to trees on the two ends, ensuring that the bridge remains suspended.
    • A ru-soam contains swinging cane loops called ahool.
    • Bamboos, or soamgur, are used to make the deck of the bridge.
    • The bridges can be 100 metres long, and two or three people can cross them at a time
  • This engineering practice reflects a sophisticated understanding of ecological balance and structural resilience.
  • The Ru-Soam cane bridges are not relics of the past; they are living expressions of engineering ingenuity.

Source: NIE

Ru-Soam Bridges FAQs

Q1: What are Ru-Soam bridges?

Ans: Traditional cane bridges built by Lepcha community in Sikkim

Q2: Ru-Soam bridges are made of which materials?

Ans: Bamboo, cane, and wood

Biosphere Reserves in India, List, Origin, Structure, Importance

Biosphere Reserve in India

Biosphere Reserves in India are designated by UNESCO (United Nations Educational, Scientific and Cultural Organization) to protect representative parts of natural and cultural landscapes. These areas may cover large terrestrial, coastal, or marine ecosystems, or a combination of both. It protects and maintains the diversity of flora, fauna, and ecosystems and promotes economic and social development that aligns with ecological conservation.

Biosphere Reserves serve as living examples of coexistence between humans and nature, demonstrating how development and conservation can progress together while respecting each other’s needs.

Biosphere Reserves

Biosphere Reserves are established by countries and recognized under UNESCO’s Man and the Biosphere (MAB) Programme. Their main goal is to promote sustainable development through local community involvement and scientific management.

These reserves encompass terrestrial, marine, and coastal ecosystems, conserving all forms of life in situ along with their support systems. They also act as reference sites for monitoring and evaluating ecological changes over time.

Part of UNESCO’s Man and Biosphere (MAB) framework since 1971, Biosphere Reserves are nominated by national governments. There are over 500 reserves across more than 100 countries, highlighting their importance in preserving ecosystems while supporting human development.

Biosphere Reserves Origin

The Biosphere Reserves programme was initiated by UNESCO in 1971, with the first reserve established in 1979. Since then, the network has grown to 686 reserves across 122 countries, including 20 transboundary sites.

Biosphere Reserves are nominated by national governments and remain under the sovereign jurisdiction of the countries where they are located. Despite this, their status is internationally recognized, highlighting their global importance in biodiversity conservation and sustainable development.

Biosphere Reserves Structure

Biosphere Reserves are structured into three interconnected zones, each designed to balance conservation with sustainable use. These zones work together to protect biodiversity while supporting research, education, and local livelihoods.

Biosphere Reserve Structure

Zone

Description

Purpose/Function

Core Area

Strictly protected ecosystem.

Conserves landscapes, ecosystems, species, and genetic variation.

Buffer Zone

Surrounds or adjoins the core area.

Supports ecological practices, scientific research, monitoring, training, and education.

Transition Area

Outermost zone with human settlements and activities.

Encourages sustainable economic and human development, blending ecological and socio-cultural needs.

Biosphere Reserves Designation Criteria

The core area should represent a typical bio-geographical unit and be large enough to sustain viable populations across all trophic levels.

  • It must include an effectively protected and minimally disturbed core zone with significant value for nature conservation.
  • The site should have potential for preserving traditional tribal or rural lifestyles that reflect harmonious use of the environment.
  • The management authority must involve and cooperate with local communities to integrate biodiversity conservation with socio-economic development.
  • Efforts should focus on managing and containing conflicts while using community knowledge and experience for sustainable outcomes.

Difference Between Biosphere Reserves and National Park & Wildlife Sanctuaries

To understand conservation in India better, it’s important to know Difference Between Biosphere Reserve and National Park & Wildlife Sanctuaries. Both aim at protecting biodiversity, but their objectives, legal backing, and approach vary.

Difference Between Biosphere Reserves and National Park & Wildlife Sanctuaries

National Park/Wildlife Sanctuary

Biosphere Reserves

National Parks, Wildlife Sanctuaries, Conservation Reserves, Community Reserves and Tiger Reserves are established as per provisions of the Wildlife Protection Act, of 1972

There is no law as such under which these Reserves are established.

No grazing or private tenurial rights land rights are allowed in National Parks.

Biosphere reserves serve as ‘living laboratories’ for testing out and demonstrating integrated management of land, water and biodiversity. Thus, limited economic activity (sand and stone mining) is permitted

Wildlife sanctuaries and national parks are set up for the protection of mammals normally

They envisage protection of plant species, Invertebrates and biotic community as a whole

List of Biosphere Reserves in India 2025

India is home to a rich natural heritage, with ecosystems, to preserve this biodiversity and promote sustainable development, the country has established 18 Biosphere Reserves. Many of these are also recognized under UNESCO’s Man and Biosphere (MAB) Programme, highlighting their global importance. These reserves not only safeguard endangered species but also protect diverse ecosystems and cultural heritage. Below is the complete List of Biosphere Reserves in India 2025, along with their year of establishment, states covered, and key species protected.

List of Biosphere Reserves in India 2025

Year

Biosphere Reserves

State(s)

Key Species

Area (km²)

1986

Nilgiri

Tamil Nadu, Karnataka, Kerala

Nilgiri Tahr, Tiger

5,520

1988

Nanda Devi

Uttarakhand

Snow Leopard, Musk Deer

5,860

1988

Nokrek

Meghalaya

Red Panda, Hoolock Gibbon

820

1989

Gulf of Mannar

Tamil Nadu

Dugong, Olive Ridley Turtle

10,500

1989

Sundarbans

West Bengal

Royal Bengal Tiger

9,630

1989

Manas

Assam

Asiatic Elephant, Golden Langur

2,837

1989

Great Nicobar

Andaman & Nicobar

Saltwater Crocodile, Nicobar Megapode

885

1994

Simlipal

Odisha

Gaur, Tiger, Elephant

4,374

1998

Dihang-Dibang

Arunachal Pradesh

Takin, Red Panda

5,112

1997

Dibru-Saikhowa

Assam

Gangetic Dolphin, Bengal Tiger

765

1999

Pachmarhi

Madhya Pradesh

Indian Giant Squirrel

4,981

2000

Khangchendzonga

Sikkim

Red Panda, Snow Leopard

2,620

2001

Agasthyamalai

Kerala, Tamil Nadu

Nilgiri Tahr, Elephant

3,500

2005

Achanakmar-Amarkantak

Madhya Pradesh, Chhattisgarh

Wild Dog, Sarus Crane

3,835

2008

Great Rann of Kutch

Gujarat

Indian Wild Ass

12,454

2009

Cold Desert

Himachal Pradesh

Snow Leopard

7,770

2010

Seshachalam Hills

Andhra Pradesh

Slender Loris

4,755

2011

Panna

Madhya Pradesh

Bengal Tiger, Chinkara

2,998

First Biosphere Reserve in India

The Nilgiri Biosphere Reserve, established in 1986, holds the distinction of being the First Biosphere Reserve in India. Spread across Tamil Nadu, Karnataka, and Kerala, it forms part of the Western Ghats, a global biodiversity hotspot. This reserve shelters a wide range of unique flora and fauna, including the endangered Nilgiri Tahr, the Lion-tailed Macaque, and the Malabar Giant Squirrel. Its diverse landscapes, from montane forests to grasslands, make it a vital ecological region, balancing conservation with the livelihood needs of local communities.

Smallest Biosphere Reserve in India

Nokrek Biosphere Reserve in Meghalaya is known as the Smallest Biosphere Reserve in India covering only 820 km². The location provides shelter to Red Panda, Hoolock Gibbon and unique citrus plant species.

Biosphere Reserve Importance

  • Conservation of Biodiversity - Protects endangered species, rare plants, animals, and ecosystems.
  • Sustainable Development - Encourages eco-tourism, organic farming, and traditional practices supporting local communities.
  • Climate Change Mitigation - Forests and wetlands act as carbon sinks, reducing global warming.
  • Research and Education - Provides opportunities for scientific research, wildlife studies, and conservation awareness.
  • Cultural Preservation - Safeguards indigenous tribes, their traditions, and sustainable lifestyles.

Biosphere Reserve Challenges

  • Human Encroachment - Expansion of agriculture, grazing, and settlements disrupts natural habitats.
  • Deforestation & Poaching - Illegal logging, hunting, and wildlife trade reduce biodiversity.
  • Climate Change - Alters rainfall, temperature, and ecosystem balance, affecting species survival.
  • Lack of Funding - Limited financial support weakens conservation and monitoring programs.
  • Tourism Pressure - Unregulated tourism leads to waste generation and habitat degradation.

Conflict with Locals - Restrictions on resource use often clash with community livelihood needs.

Also Check Other Posts
Biosphere Reserves in India National Parks in India
Waterfalls in India Highest Peak in India
Ramsar Sites in India Wildlife Sanctuaries in India
Dams in India Tiger Reserves in India
Mountain Passes in India Longest Bridge in India

Biosphere Reserves in India FAQs

Q1: What is meant by biosphere reserve?

Ans: A biosphere reserve is a protected area conserving biodiversity, supporting sustainable development, and prompting research and education for environmental protection.

Q2: How many biosphere reserves are in India?

Ans: India has 18 biosphere reserves, of which 12 are part of UNESCO’s World Network of Biosphere Reserves.

Q3: Is biosphere reserve class 8?

Ans: Yes, the concept of biosphere reserves is introduced in Class 8 NCERT Geography to explain biodiversity conservation.

Q4: What is the difference between a national park and a biosphere reserve?

Ans: A national park protects specific wildlife, while a biosphere reserve conserves biodiversity, includes human settlements, and promotes sustainable use.

Q5: Which is the largest biosphere reserve in India?

Ans: The Gulf of Mannar Biosphere Reserve in Tamil Nadu is the largest in India.

National Company Law Tribunal

National Company Law Tribunal

National Company Law Tribunal Latest News

Recently, the Supreme Court has taken suo motu cognisance of delays by National Company Law Tribunal (NCLT) benches in approving resolution plans under the Insolvency and Bankruptcy Code (IBC).

About National Company Law Tribunal

  • It is a quasi-judicial authority incorporated for dealing with corporate disputes that are of civil nature arising under the Companies Act,2013.
  • It was constituted on 1 June 2016 under the Companies Act, 2013.
    • It was established based on the recommendation of the Balakrishna Eradi committee on law relating to the insolvency and the winding up of companies.
  • Composition: It shall consist of a President and such number of Judicial and Technical Members as may be required.
  • Appeal: Decisions of the tribunal may be appealed to the National Company Law Appellate Tribunal, the decisions of which may further be appealed to the Supreme Court of India on a point of law.

Powers of National Company Law Tribunal

  • It is guided by the principles of natural justice, subject to the other provisions of this Act and of any rules that are made by the Central Government.
  • It can enforce any order that it gives in the same manner as a court would enforce it.
  • It has the power to scrutinize its own orders.
  • It has the power to regulate their own procedure.
  • It is the adjudicating authority for the insolvency resolution process of companies and limited liability partnerships under the Insolvency and Bankruptcy Code, 2016.

Source: NIE

National Company Law Tribunal FAQs

Q1: Which Ministry exercises administrative control over NCLT?

Ans: Ministry of Corporate Affairs

Q2: Under which Act was NCLT established?

Ans: Companies Act, 2013

Economic Survey 2025-26 Out, Key Highlights, Features, PDF Download

Economic Survey 2026 Out

The Economic Survey 2026 is one of the most important official documents released by the Government of India every year. It acts as a comprehensive report card of the Indian economy and provides a clear picture of economic performance, challenges, opportunities, and future policy directions. It is released just before the Union Budget, the Economic Survey plays a crucial role in shaping fiscal decisions and long-term economic planning.

What is the Economic Survey?

The Economic Survey is an annual document prepared by the Department of Economic Affairs, Ministry of Finance, under the supervision of the Chief Economic Adviser (CEA) of India. It presents a detailed analysis of the Indian economy’s performance during the previous financial year.

Features of the Economic Survey

  • Economic Survey 2026 provides a comprehensive analysis of India’s economic performance, including growth, inflation, employment, and fiscal trends.
  • It evaluates sector-wise performance such as agriculture, industry, services, and infrastructure.
  • It is released every year before the Union Budget to provide an economic background for policy formulation.
  • The document is data-driven and analytical in nature, based on official statistics and economic indicators.
  • It reviews government policies and reforms while suggesting future economic strategies.
  • The Economic Survey serves as an important reference for policymakers and researchers.

Economic Survey 2026 History

The Economic Survey was first presented in 1950–51 as a part of the Union Budget documents to provide an overview of India’s economic performance. However, in 1964, it was separated from the Budget and began to be presented as an independent document. This change was introduced to ensure a more detailed and objective review of economic developments before the presentation of the Union Budget. The separation allowed policymakers and Parliament to analyze economic trends, challenges, and opportunities in advance, thereby enabling better-informed fiscal decisions. 

In line with this tradition, the Economic Survey 2026 has been released on 29th January 2026, before the Union Budget 2026-27, which will be presented on 1st February 2026.

Economic Survey 2025-26 PDF Download

The Economic Survey 2025-26 PDF is officially released by the Government of India for public access. It provides a detailed review of the country’s economic performance, sector-wise analysis, and policy recommendations. This year, the Economic Survey 2026 has been released on 29th January 2026, ahead of the Union Budget. The PDF can be downloaded from the official government portals for reference by students, researchers, and policymakers.

Download Economic Survey 2025-26 PDF

Economic Survey 2026 Key Highlights

The Economic Survey 2026 highlights India’s continued macroeconomic resilience, with FY26 real GDP growth estimated at 7.4%, low inflation, improved fiscal consolidation, and a strong banking and external sector despite global uncertainties. It underscores structural transformation driven by robust services growth, manufacturing revival, infrastructure expansion, digital and financial inclusion, poverty reduction, and a long-term vision of strategic resilience and strategic indispensability under the Viksit Bharat 2047 framework.

1. Overall State of the Economy

  • India remained the fastest-growing major economy for the fourth consecutive year, despite global headwinds such as geopolitical tensions, trade fragmentation and financial instability.
  • As per First Advance Estimates, real GDP growth for FY26 is projected at 7.4%, while GVA growth is estimated at 7.3%, indicating broad-based economic expansion.
  • Potential growth rate of the Indian economy is assessed at around 7%, with FY27 real GDP growth projected between 6.8–7.2%.

2. Consumption and Investment

  • Private Final Consumption Expenditure (PFCE) grew by 7% in FY26, reaching 61.5% of GDP, the highest level since 2012, reflecting strong domestic demand.
  • Rural consumption improved due to a good agricultural performance, while urban demand was supported by stable employment and tax rationalisation.
  • Gross Fixed Capital Formation (GFCF) rose by 7.8%, remaining steady at 30% of GDP, driven by sustained public capital expenditure and revival of private investment.

3. Fiscal Developments

  • Centre’s revenue receipts increased to 9.2% of GDP in FY25, up from the pre-pandemic average of about 8.5%, reflecting improved tax buoyancy.
  • The direct tax base expanded, with income tax return filers increasing from 6.9 crore in FY22 to 9.2 crore in FY25, indicating better compliance and formalisation.
  • Gross GST collections during April–December 2025 stood at ₹17.4 lakh crore, registering a 6.7% year-on-year growth.
  • Effective capital expenditure of the Centre rose to about 4% of GDP in FY25, reinforcing growth through infrastructure creation.
  • India reduced its general government debt-to-GDP ratio by 7.1 percentage points since 2020, while maintaining high public investment.

4. Monetary Management and Banking Sector

  • The banking system showed strong resilience, with Gross NPAs declining to 2.2% in September 2025, a multi-decadal low.
  • Net NPAs declined further to 0.5%, reflecting improved asset quality and stronger balance sheets.
  • Credit growth of scheduled commercial banks accelerated to 14.5% (YoY) by December 2025, supporting economic activity.

5. Financial Inclusion and Capital Markets

  • Under PM Jan Dhan Yojana, 55.02 crore bank accounts were opened by March 2025, with 36.63 crore accounts in rural and semi-urban areas.
  • The number of unique investors crossed 12 crore in September 2025, with nearly 25% being women, highlighting widening financial participation.
  • Mutual fund penetration expanded beyond metros, with a growing share of investors from non-tier I and II cities.
  • GIFT City is emerging as an international financial hub, helping channel global capital into India.

6. External Sector Performance

  • India’s share in global merchandise exports nearly doubled from 1% in 2005 to 1.8% in 2024, while services export share rose from 2% to 4.3%.
  • Total exports reached a record USD 825.3 billion in FY25, driven mainly by services exports.
  • Services exports touched an all-time high of USD 387.6 billion, growing by 13.6%.
  • India remained the largest recipient of remittances globally, with inflows of USD 135.4 billion in FY25, approximately 3.5% of GDP.
  • Foreign exchange reserves rose to USD 701.4 billion (January 2026), providing import cover of about 11 months and covering 94% of external debt.

7. Inflation Trends

  • India recorded the lowest average CPI inflation (1.7%) for April–December 2025 since the beginning of the CPI series.
  • The sharp decline in inflation was mainly due to moderation in food and fuel prices, strengthening household purchasing power.

8. Agriculture and Allied Sectors

  • Foodgrain production reached 3,577.3 LMT in AY 2024–25, an increase of 254.3 LMT over the previous year.
  • Horticulture, contributing about one-third of agricultural GVA, produced 362.08 MT, surpassing foodgrain outp ut.
  • Livestock and fisheries sectors showed strong long-term growth with fish production increasing by more than 140 per cent during 2014-2024, compared to the increase from 2004-14, reflecting diversification of rural incomes.
  • Under PM-KISAN, more than ₹4.09 lakh crore has been transferred to farmers, strengthening income support.
  • e-NAM enhanced price discovery by integrating farmers, traders and FPOs across States.

9. Services Sector

  • Services accounted for 53.6% of GDP and 56.4% of GVA, the highest ever, reflecting India’s shift towards a service-led economy.
  • India emerged as the 7th largest services exporter globally, driven by IT, business services and digitally delivered services.
  • The services sector attracted over 80% of total FDI inflows during FY23–FY25.

10. Industry and Manufacturing

  • Industry GVA (in real terms) grew by 7% in H1 FY26, despite global slowdown pressures.
  • Manufacturing GVA accelerated to 7.72% in Q1 and 9.13% in Q2 FY26, indicating structural recovery.
  • PLI schemes across 14 sectors attracted over ₹2 lakh crore in investment, generated ₹18.7 lakh crore in output, and created 12.6 lakh jobs.
  • The India Semiconductor Mission advanced domestic manufacturing with ₹1.6 lakh crore investment across 10 projects.

11. Infrastructure and Connectivity

  • Central government capital expenditure increased over four times since FY18, reaching ₹11.21 lakh crore in FY26 (BE).
  • High-speed highway corridors expanded nearly ten-fold to 5,364 km.
  • Railway network expanded with near-total electrification (99.1%).
  • India became the 3rd largest domestic aviation market, with airports increasing from 74 (2014) to 164 (2025).
  • Power sector reforms led to DISCOMs recording a positive PAT of ₹2,701 crore in FY25 for the first time.

12. Social Sector: Education, Health and Employment

  • School enrolment improved with GERs exceeding 90% at primary and upper primary levels.
  • Expansion of premier institutions: 23 IITs, 21 IIMs and 20 AIIMS, including overseas IIT campuses.
  • India achieved faster reduction in maternal and child mortality than global averages since 1990.
  • Employment (15 years & above) stood at 56.2 crore persons in Q2 FY26, with new job creation supported by manufacturing and services.
  • e-Shram portal registered over 31 crore unorganised workers, with women forming 54%.

13. Poverty Reduction and Rural Development

  • Multidimensional Poverty Index (MPI) declined sharply from 55.3% (2005–06) to 11.28% (2022–23) as per NITI Aayog.
  • Social Services Expenditure increased to 7.9% of GDP in FY26 (BE).
  • SVAMITVA scheme improved rural asset ownership through drone-based property mapping.

14. Strategic Vision: From Swadeshi to Strategic Indispensability

  • The Survey advocates “Disciplined Swadeshi” through a three-tier framework focusing on strategic urgency, feasibility and cost-effectiveness.
  • Emphasises reducing input costs, strengthening advanced manufacturing, and integrating India into global value chains.
  • The long-term goal is to make India strategically indispensable in the global economic system.

[youtube url="https://www.youtube.com/watch?v=Wu66P3clSAU" width="560" height="315"]

Why is the Economic Survey 2026 Released Before the Union Budget?

The Economic Survey 2026 is released before the Union Budget to provide a detailed review of India’s economic performance and trends. It helps policymakers and Parliament understand the current economic situation and challenges. The Survey acts as a guide for budget formulation and prioritizing government spending. Releasing it beforehand ensures informed decision-making and transparency in fiscal planning.

Difference Between Union Budget and Economic Survey

The Economic Survey is an analytical document that reviews India’s economic performance and provides policy insights, while the Union Budget is a financial statement outlining government revenue, expenditure, and fiscal priorities. The Survey is presented before the Budget to guide policy decisions. Together, they provide a complete picture of India’s economic strategy and planning

Difference Between Union Budget and Economic Survey
Aspect Economic Survey Union Budget

Nature

Analytical document assessing the economy

Financial and legal statement of government’s revenue and expenditure

Purpose

Review past economic performance and provide policy recommendations

Allocate resources, announce taxes, and set fiscal priorities

Content

GDP trends, inflation, employment, sector-wise performance, and policy suggestions

Tax proposals, government spending, fiscal deficit, and schemes

Timing

Released before the Budget

Released after the Economic Survey

Binding Nature

Non-binding, advisory in nature

Legally binding financial plan for the fiscal year

Prepared by

Chief Economic Adviser and Ministry of Finance

Finance Minister with Ministry of Finance support

Focus

Economic trends, challenges, and future outlook

Financial planning, allocation of resources, and fiscal management

Usefulness

Helps policymakers, researchers, and analysts understand economic conditions

Directly affects citizens, businesses, and government programs

Political Nature

Objective and neutral

Policy-oriented and may include government priorities

Frequency

Annually

Annually

Economic Survey 2026 FAQs

Q1: What is the Economic Survey 2026?

Ans: The Economic Survey 2026 is an annual report that reviews India’s economic performance over the past year, highlights trends and challenges, and offers analytical insights before the Union Budget.

Q2: Who prepares the Economic Survey?

Ans: It is prepared by the Ministry of Finance under the guidance of the Chief Economic Adviser (CEA).

Q3: When is the Economic Survey 2026 released?

Ans: The Economic Survey 2026 has been released on 29th January 2026, ahead of the Union Budget.

Q4: Why is the Economic Survey released before the Union Budget?

Ans: It is released because it provides a detailed economic review and context that helps policymakers and Parliament make informed budgetary decisions.

Q5: What does the Economic Survey include?

Ans: It includes economic data, macroeconomic trends, sector‑wise analysis, policy insights, projections, and recommendations for future growth.

Five Year Plans in India, History, Objectives, Complete List

Five Year Plan in India

The Five Year Plan in India was a systematic approach to economic development introduced after Independence to ensure planned use of resources and balanced growth. India implemented twelve Five Year Plans between 1951 and 2017, covering agriculture, industry, infrastructure, education, and welfare sectors. The planning system was discontinued after the Twelfth Five-Year Plan, and a more flexible policy framework under NITI Aayog replaced it, as discussed in detail in the article below.

What is Five Year Plans in India?

The Five Year Plans in India was a centralized economic planning mechanism under which the government set specific economic, social, and developmental targets to be achieved over a period of five years.

The planning process was formulated and implemented by the Planning Commission of India, which was established in 1950. Each plan outlined sector-wise priorities such as agriculture, industry, education, health, infrastructure, and social justice, keeping in view the country’s developmental needs.

Five Year Plans in India History

India adopted the Five Year Plans model in 1951 to achieve planned economic development after Independence, inspired by the Soviet Union’s centralized planning system. The plans aimed to address poverty, low industrial base, and uneven development through systematic resource allocation.

  • Planning Commission was established in 1950 under the chairmanship of the Prime Minister
  • First Five Year Plan (1951-56) focused mainly on agriculture and irrigation
  • Early plans emphasized state-led industrialization and public sector growth
  • Plan Holiday (1966-69) occurred due to wars, droughts, and economic instability
  • Economic reforms in 1991 changed the planning approach toward liberalization
  • Twelfth Five Year Plan (2012-17) was the last plan before discontinuation
  • Planning Commission was replaced by NITI Aayog in 2015
  • Five Year Plans ended in 2017 to adopt a flexible and cooperative federal framework

Five Year Plans in India Objectives

The major objectives of the Five Year Plans in India were:

  • Economic Growth: Achieving rapid and sustained economic development by increasing national income and productivity.
  • Self-Reliance: Reducing dependence on imports and promoting domestic production, especially in key industries.
  • Social Justice: Reducing inequalities of income, wealth, and opportunities across regions and communities.
  • Poverty Alleviation: Addressing unemployment, poverty, and underdevelopment through targeted programs.
  • Balanced Regional Development: Ensuring equitable growth across states and backward regions.
  • Modernization: Promoting technological advancement, industrial diversification, and human capital development.

List of Five Year Plans in India

India implemented Twelve Five Year Plans between 1951 and 2017 to guide economic and social development in a planned manner. These plans were formulated by the Planning Commission and focused on areas such as agriculture, industrialisation, poverty reduction, and inclusive growth. The Twelfth Five-Year Plan (2012-17) was the last plan, after which the Planning Commission was replaced by NITI Aayog and the planning system was discontinued.

First Five-Year Plan (1951-56)

  • Marked the beginning of planned economic development in independent India, aiming to stabilise the economy after Partition.
  • Presented to Parliament by Jawaharlal Nehru, reflecting a mixed economy approach with state intervention.
  • K. N. Raj advocated a cautious growth path, arguing that India should “hasten slowly” to avoid inflation and instability.
  • Priority was given to agriculture, irrigation, and food security, as nearly 70% of the population depended on agriculture.
  • Large-scale investments were made in multipurpose river valley projects like Bhakra Nangal, Damodar Valley, and Hirakud.
  • Based on the Harrod-Domar Model, stressing capital formation through higher savings and investment.
  • Strengthened institutional framework by establishing five IITs to build technical manpower.
  • Target growth rate: 2.1% | Achieved growth rate: 3.6%, indicating strong early success.

Second Five-Year Plan (1956-61)

  • Shifted focus from agriculture to rapid industrialisation, especially heavy and capital goods industries.
  • Planned under P. C. Mahalanobis, whose model prioritised long-term industrial capacity over short-term consumption.
  • Emphasised development of public sector enterprises in steel, power, and machine tools.
  • Established major steel plants at Bhilai, Rourkela, and Durgapur, laying the foundation of industrial India.
  • Introduced import substitution by imposing high tariffs to protect domestic industries.
  • Faced challenges of inflation, balance of payments pressure, and limited foreign exchange.
  • Target growth rate: 4.5% | Actual growth rate: 4.27%.

Third Five-Year Plan (1961-66)

  • Aimed to make India a self-reliant economy with balanced growth of agriculture and industry.
  • Focused on wheat production, fertilisers, and agricultural expansion to reduce food imports.
  • Greater decentralisation, assigning states more responsibility for education and development.
  • Introduction of Panchayat elections strengthened democratic governance at the grassroots.
  • External shocks such as the 1962 China war, 1965 Pakistan war, and consecutive droughts disrupted the plan.
  • Severe fiscal stress and inflation led to poor outcomes.
  • Target growth rate: 5.6% | Actual growth rate: 2.4%, resulting in plan failure.

Plan Holidays (1966-69)

  • Implemented due to economic crisis following the failure of the Third Plan.
  • Consisted of three Annual Plans focusing on short-term stabilization.
  • Priority given to controlling inflation, food security, and restoring economic balance.

Fourth Five-Year Plan (1969-74)

  • Introduced under Indira Gandhi with an emphasis on correcting earlier distortions.
  • Based on the Gadgil Formula, ensuring balanced regional development.
  • Core objectives were growth with stability and self-reliance.
  • Nationalisation of 14 banks expanded institutional credit to agriculture and small industries.
  • Green Revolution significantly increased food grain production, especially wheat.
  • Launch of Drought Prone Area Programme (DPAP) to address regional vulnerabilities.
  • Target growth rate: 5.6% | Actual growth rate: 3.3%.

Fifth Five-Year Plan (1974-78)

  • Strongly focused on poverty alleviation and employment generation under the slogan Garibi Hatao.
  • Emphasised redistribution of income and reduction of inequalities.
  • Minimum Needs Programme (MNP) aimed at providing basic services like health, education, housing, and water.
  • Expansion of power sector after amendment of the Electricity Supply Act, 1975.
  • Development of the National Highway System to improve connectivity.
  • Target growth rate: 4.4% | Actual growth rate: 4.8%.
  • Discontinued in 1978 due to political change.

Rolling Plan (1978-80)

  • Introduced by the Janata Party government to ensure flexibility in planning.
  • Plans were revised annually based on performance evaluation.
  • Allowed adjustments in targets and resource allocation each year.
  • Abandoned after political transition in 1980.

Sixth Five-Year Plan (1980-1985)

  • Marked a major shift in India’s economic strategy, moving gradually from strict state control toward economic liberalisation.
  • Considered the end of Nehruvian Socialism, as price controls, licensing, and excessive regulation were reduced.
  • Focused on modernisation of industries, efficiency improvement, and technological upgradation.
  • Introduced family planning and population control measures to address demographic pressure on resources.
  • Strengthened rural and agricultural credit by establishing the National Bank for Agriculture and Rural Development (NABARD) in 1982, based on the Shivaraman Committee’s recommendations.
  • Prioritised development of energy, transport, and communication infrastructure to support industrial growth.
  • Encouraged greater participation of the private sector while retaining a strong public sector presence.
  • Target growth rate: 5.2%
  • Actual growth rate: 5.7%, making it one of the more successful Five Year Plans.

Seventh Five-Year Plan (1985-1990)

  • Implemented under the leadership of Prime Minister Rajiv Gandhi, focusing on technology-driven economic growth.
  • Emphasised modernisation of industries through the adoption of computers, electronics, and telecommunications.
  • Aimed to improve industrial productivity and efficiency, reducing reliance on outdated production methods.
  • Strengthened anti-poverty initiatives and welfare schemes to promote social justice.
  • Encouraged self-sustained economic growth, reducing long-term dependence on external assistance.
  • Laid emphasis on food grain production to ensure food security and price stability.
  • Promoted a shift towards a knowledge-based economy, laying groundwork for future IT sector growth.
  • Aimed to achieve the prerequisites for self-reliant growth by the year 2000.
  • Target growth rate: 5.0%
  • Actual growth rate: 6.01%, indicating robust economic performance.

Annual Plans (1990-1992)

  • The regular Five Year Plan framework was suspended due to political instability and severe economic crisis.
  • India faced an acute balance of payments and foreign exchange crisis, with reserves barely sufficient for a few weeks of imports.
  • High fiscal deficit, rising inflation, and declining industrial growth worsened economic conditions.
  • These years acted as a transition phase before comprehensive structural reforms.
  • Under Prime Minister P. V. Narasimha Rao, India initiated Liberalisation, Privatisation, and Globalisation (LPG) reforms.
  • Major measures included industrial delicensing, reduction in import tariffs, and encouragement of foreign investment.
  • The role of the private sector was expanded, while government control over the economy was reduced.

Eighth Five-Year Plan (1992-1997)

  • The first Five Year Plan implemented after the 1991 economic reforms.
  • Marked a decisive shift from centralised planning to a market-driven growth strategy.
  • Focused on modernisation of industries, improving efficiency, and global competitiveness.
  • Emphasised human resource development, especially in education, health, and skill formation.
  • Aimed to control population growth, reduce poverty, and generate employment opportunities.
  • Gave high priority to the development of infrastructure sectors such as power, roads, and telecommunications.
  • Encouraged private sector participation and foreign direct investment (FDI).
  • India became a member of the World Trade Organisation (WTO) in 1995, integrating with the global economy.
  • Target growth rate: 5.6%
  • Actual growth rate: 6.8%, reflecting strong economic performance.

Ninth Five-Year Plan (1997-2002)

  • Implemented during the period marking 50 years of Indian Independence.
  • Led under the Prime Ministership of Atal Bihari Vajpayee.
  • Theme of the plan was “Growth with Social Justice.”
  • Sought to balance rapid economic growth with improvement in quality of life.
  • Emphasised poverty eradication, human development, and social sector expansion.
  • Focused on empowering socially and economically backward classes.
  • Aimed to ensure universal access to primary education and improve health outcomes.
  • Encouraged public-private partnership (PPP) to accelerate economic development.
  • Target growth rate: 7.1%
  • Actual growth rate: 6.8%, slightly below expectations.

Tenth Five-Year Plan (2002-2007)

  • The Tenth Plan marked a clear shift towards inclusive and equitable economic growth.
  • Aimed at achieving an average annual GDP growth of 8%, focusing on both growth and distribution.
  • One of its key objectives was to reduce poverty by half during the plan period.
  • Targeted creation of 80 million employment opportunities, especially in agriculture, manufacturing, and services.
  • Emphasised reduction of regional disparities by promoting balanced development across states.
  • Focused on strengthening education, health, and skill development to improve human capital.
  • Sought to reduce gender inequality, particularly in education and wage employment.
  • Target growth rate: 8.1%
  • Actual growth rate: 7.6%, slightly below the target but considered relatively strong.

Eleventh Five-Year Plan (2007-2012)

  • The theme of the Eleventh Five-Year Plan was “Faster and More Inclusive Growth.”
  • Placed strong emphasis on social sector development, especially education, health, and skill formation.
  • Aimed to expand access to higher education, including universities, distance learning, and IT institutes.
  • The Right to Education Act (2009) was enacted, making free and compulsory education for children aged 6-14 years.
  • Focused on employment generation, particularly for youth, through skill development initiatives.
  • Sought to reduce poverty, gender inequality, and regional imbalances.
  • Emphasised environmental sustainability and sustainable use of natural resources.
  • Prepared under the leadership of C. Rangarajan.
  • Targeted provision of safe and clean drinking water for all.
  • Target growth rate: 9%
  • Actual growth rate: 8%, affected partly by the global financial crisis (2008).

Twelfth Five-Year Plan (2012-2017)

  • The Twelfth Plan was the last --Year Plan implemented in India.
  • Its theme was “Faster, More Inclusive and Sustainable Growth.”
  • Focused on strengthening infrastructure, including power, roads, railways, and urban development.
  • Aimed to ensure electricity access to all villages and improve energy efficiency.
  • Emphasised reducing social and gender gaps in school and higher education enrolment.
  • Promoted skill development and employment generation, especially in non-farm sectors.
  • Stressed environmental sustainability, with a target to increase green cover by 1 million hectares annually.
  • Encouraged innovation, improved governance, and better delivery of public services.

Initially targeted 9% growth, later revised to 8% by the National Development Council.

Five Year Plans in India FAQs

Q1: Who introduced the Five Year Plans in India?

Ans: The Five Year Plans were introduced by the Government of India with the establishment of the Planning Commission in 1950.

Q2: Which was the first Five Year Plan in India?

Ans: The First Five Year Plan was launched in 1951 under the leadership of Jawaharlal Nehru.

Q3: How many Five Year Plans were implemented in India?

Ans: India implemented 12 Five Year Plans between 1951 and 2017.

Q4: Why were Five Year Plans discontinued in India?

Ans: They were discontinued to adopt a more flexible, decentralized, and market-driven planning approach through NITI Aayog.

Q5: What replaced the Five Year Plans in India?

Ans: The NITI Aayog replaced the Planning Commission and introduced long-term vision documents and action agendas.

Sacred Groves

Sacred Grove

Sacred Groves Latest News

The Kerala State Biodiversity Board (KSBB) recently initiated a pilot restoration programme for sacred groves in collaboration with the local Biodiversity Management Committees.

About Sacred Groves

  • A sacred grove comprises patches of natural vegetation – from a few trees to several acres – that are dedicated to local deities or tree spirits. 
  • These spaces are protected by local communities because of their religious beliefs and traditional rituals that run through several generations. 
  • These are some of the most valuable, primitive practices of nature conservation. 
  • They act as repositories of biodiversity, sheltering rare plant and animal species.
  • Hunting and deforestation are usually prohibited, while sustainable activities such as honey collection or gathering deadwood are permitted.
  • The total number of sacred groves in India is more than 1,00,000. These groves are found all over the country with local names and associated deities. 
  • They are particularly found in regions like:
    • The Western Ghats
    • The Himalayas
    • The northeastern hill tracts
    • Central India
  • Regional Names for Sacred Groves:
    • Dev Van in Himachal Pradesh
    • Bugyal or Dev Van in Uttarakhand
    • Than and Madaico in Assam
    • Matagudi, Devgudi, or Sarana in Chhattisgarh
    • Jaherthan or Sarana in Jharkhand
    • Devarakadu in Karnataka
    • Kavu or Sarpa Kavu in Kerala
    • Kovilkaadu in Tamil Nadu
    • Devrai or Devgudi in Maharashtra
    • Law Kyntang or Asong Khosi in Meghalaya
    • Orans in Rajasthan.
    • Jahera or Thakuramma in Odisha

Source: TH

Sacred Groves FAQs

Q1: What is a sacred grove?

Ans: A sacred grove is a patch of natural vegetation dedicated to local deities or tree spirits.

Q2: Why are sacred groves protected by local communities?

Ans: They are protected due to religious beliefs and traditional rituals.

Q3: What is the ecological importance of sacred groves?

Ans: They act as repositories of biodiversity and shelter rare plant and animal species.

Q4: Where are sacred groves commonly found in India?

Ans: They are found across India, especially in the Western Ghats, Himalayas, northeastern hill tracts, and Central India.

Canine Distemper

Canine Distemper

Canine Distemper Latest News

A tigress and her four cubs died in Kanha Tiger Reserve recently, prompting concerns over a Canine Distemper Virus outbreak.

About Canine Distemper

  • It is a contagious and serious disease caused by the canine distemper virus (CDV).
  • The virus attacks the respiratory, gastrointestinal, and nervous systems of dogs and has a very high mortality rate.
  • All dogs are at risk of canine distemper. Those at particular risk include puppies younger than four months and dogs that have not been vaccinated against CDV.
  • CDV is a worldwide multi-host pathogen and is increasingly found in wildlife species, including carnivores, large felids, marine mammals, and non-human primates. 

Canine Distemper Transmission

  • It is spread through direct contact or airborne exposure.
  • The virus does not last long in the environment and can be destroyed by most disinfectants. 
  • However, the distemper-infected dogs can shed the virus for up to several months.
  • Once a dog is infected, the virus quickly spreads throughout the entire body and significantly weakens the immune system, leaving them susceptible to secondary infections.

Canine Distemper Symptoms

  • Symptoms of distemper vary a great deal, depending which organs are affected, symptoms are usually:
    • cough
    • fever
    • inappetence
    • lethargy
    • runny eyes and nose
    • diarrhoea.
  • This can then progress to more severe symptoms, including:
    • thickened nose and foot pads
    • tremors
    • paralysis
    • seizures.

Canine Distemper Treatment

  • There is no cure, and no antiviral drugs have been approved to combat the infection. 
  • The best way to prevent canine distemper is through vaccination.

Source: TH

Canine Distemper FAQs

Q1: What is Canine Distemper?

Ans: Canine distemper is a contagious and serious disease caused by the canine distemper virus (CDV).

Q2: Which systems are affected by the canine distemper virus?

Ans: It affects the respiratory, gastrointestinal, and nervous systems.

Q3: Is canine distemper limited only to dogs?

Ans: No, it is a multi-host pathogen affecting wildlife species including carnivores, large felids, marine mammals, and non-human primates.

Q4: How is canine distemper transmitted?

Ans: It spreads through direct contact or airborne exposure.

Q5: Is there a cure for canine distemper?

Ans: No, there is no cure.

Brain Death Certification: Why Brain Death Certification Is Under Supreme Court Review

Brain Death Certification

Brain Death Certification Latest News

  • The Supreme Court of India is reviewing the process of brain death certification and has sought expert opinion from All India Institute of Medical Sciences doctors on whether additional tests like EEG and angiograms should be included.
  • The case stems from allegations that some patients may be incorrectly declared brain dead to facilitate organ donation. Concerns have been raised about the reliability of the current apnea test, which can be subjective, and the lack of adherence to rules such as mandatory videography of the procedure.

Brain Death: Meaning and Medical Significance

  • Brain Death, also called brain stem death, is an irreversible condition in which all brain activity—including vital functions like breathing controlled by the brain stem—completely stops. 
  • Although the patient may appear alive due to machines like ventilators keeping the heart beating and blood circulating, there is no possibility of recovery, and the person is medically considered dead.

Causes and Clinical Context

  • Brain death typically occurs after severe brain injuries, such as those from road accidents or falls, where the brain is deprived of oxygen. 
  • These injuries permanently damage brain function, making revival impossible.

Importance in Organ Donation

  • Patients who are brain dead are crucial for organ donation, as life support systems keep organs viable. 
  • They can donate vital organs such as the heart and lungs, which living donors cannot. 
  • While organ donation is also possible after circulatory death (when heartbeat and breathing stop), brain-dead donors remain the most common source.

Need for Brain Death Declaration in Organ Donation

  • Declaring Brain Death is crucial for deceased organ donation, allowing vital organs like the kidney, liver, heart, and eyes to be transplanted to unrelated recipients. 
  • It provides an alternative to living donor transplants, which, although safer today, still involve health risks for donors.
  • India performs a large number of transplants globally, but most rely on living relatives due to limited deceased donations. 

Huge Gap Between Potential and Actual Donations

  • Despite around 1.5 lakh deaths from traumatic brain injuries and 50,000 from strokes annually—many of whom could qualify as brain-dead donors—only about 1,100 people donate organs. 
  • India’s deceased donation rate is just 0.77 per million population, far below countries like Thailand (6.21), China (4.5), Sri Lanka (3.38), and Japan (1.18).
    • There are 48 deceased donations per million population in Spain, which has one of the highest deceased donations.

Protocol for Declaring Brain Death in India

  • The National Organ and Tissue Transplant Organisation mandates that brain death be certified by a four-member medical board, including the hospital in-charge, a neurologist or neurosurgeon, and the treating physician. 
  • The board must confirm irreversible loss of brain function twice, with a minimum 12-hour gap, and document the cause of the condition.
  • Before declaring Brain Death, doctors must rule out reversible factors such as drug or alcohol influence, hypothermia, and metabolic disturbances, ensuring that the condition is truly irreversible.

No Mandatory Advanced Tests

  • Current guidelines do not mandate advanced tests such as EEG or angiograms. 
  • According to experts at AIIMS, hospitals sometimes follow even stricter protocols, repeating tests more than twice to ensure accuracy.

EEG and Angiogram in Brain Death Certification

  • An Electroencephalogram records the brain’s electrical activity using electrodes placed on the scalp. In cases of Brain Death, it shows no detectable electrical signals, indicating complete cessation of brain function.
  • A Cerebral Angiogram uses contrast dye and X-rays to assess blood flow in the brain. In brain death, it reveals absence of blood circulation to the brain, confirming irreversible damage.
  • While current bedside clinical tests can strongly indicate brain death, EEG and angiogram provide more definitive, objective confirmation by directly demonstrating the absence of brain activity and blood flow.

Practical Challenges in Use

  • Despite their accuracy, these tests face significant practical limitations. 
  • They are mainly available in tertiary and super-speciality hospitals, making them inaccessible for many smaller centres. 
  • Mandating them universally could reduce brain death certification and organ donation rates, as smaller hospitals may be unable to comply.

Challenges in Brain Death Certification

  • Lack of Awareness and Training - A major issue is limited knowledge among doctors, leading to many potential brain-dead patients not being formally declared or considered for organ donation. Studies show over half of physicians lack formal training in certification.
  • Inadequate Postgraduate Training - Training for resident doctors is inconsistent. Even in teaching hospitals, only a small proportion of doctors regularly train residents in brain death certification.
  • Absence of Standardised Curriculum - Many institutions do not have a fixed curriculum, resulting in uneven understanding and application of certification protocols across hospitals.

Source: IE

Brain Death Certification FAQs

Q1: What is brain death certification?

Ans: Brain death certification is the medical and legal process of declaring irreversible loss of brain function, enabling deceased organ donation and confirming death despite artificial life support.

Q2: Why is brain death certification under Supreme Court review?

Ans: Brain death certification is under review due to allegations of misuse, concerns over subjective apnea tests, and demands for adding objective tests like EEG and angiograms.

Q3: What tests are used in brain death certification?

Ans: Brain death certification currently relies on bedside clinical tests, but EEG and angiograms can provide objective confirmation by showing absence of brain activity and blood flow.

Q4: What are challenges in brain death certification?

Ans: Brain death certification faces challenges like lack of training among doctors, inconsistent protocols, absence of standard curriculum, and limited access to advanced diagnostic facilities.

Q5: Why is brain death certification important for organ donation?

Ans: Brain death certification is essential for increasing deceased organ donation, reducing reliance on living donors, and addressing the gap between potential donors and actual transplant availability.

Easter Island

Easter Island

Easter Island Latest News

A groundbreaking study suggests that the ancient Rongorongo script of Easter Island could be independently developed and predates the arrival of Europeans on the island.

About Easter Island

  • It is a Chilean dependency in the eastern Pacific Ocean.
  • It is the easternmost outpost of the Polynesian island world.
  • Named Rapa Nui by its earliest residents, it is one of the most isolated inhabited islands in the world. 
  • It was discovered by Europeans on Easter Sunday (1722) by Dutch explorer Jacob Roggeveen. Hence the name “Easter Island”.
  • In between Roggeveen’s arrival and its annexation to Chile, the Rapanui population declined drastically due to their enslavement on the South American mainland by the Peruvians and from the smallpox and tuberculosis epidemics on the island.  
  • Covering a total area of 163.6 sq.km, it is situated about 3,540 km to the west of Chile and about 1,900 km to the east of Pitcairn Island.
  • It is a small, triangular-shaped volcanic island.
  • It faces a tropical rainforest climate.
  • The island comprises three extinct volcanoes, namely Terevaka, Poike, and Rano Kau.  
  • The island has no permanent rivers but contains three crater lakes, namely Rano Aroi, Rano Raraku, and Rano Kau. 
  • It is known for its iconic Moai statues, carved by the indigenous Rapa Nui people.
  • UNESCO named Easter Island a World Heritage Site on March 22, 1996, and major parts of the island have been protected under the Rapa Nui National Park.

What are Moai Statues?

  • Rapa Nui is famous for its large statues called moai.
  • They are shaped like large human heads and erected on stone pedestals.
  • They are famous for their carved heads and “Pukao,” a hat-like covering made from a soft red stone.
  • Some moai stand 40 feet tall and weigh 75 tonnes.
  • They were carved in volcanic stone at quarries and then moved to their current locations across the island.
  • Scholars believe the Rapa Nui people built the moai between the 13th and the 16th centuries and represented their revered ancestors.
  • Over 900 moai have been found on the island to date.

What is Rongorongo?

  • Rongorongo is a writing system that comprises carved symbols, known as glyphs, on wooden tablets and artefacts discovered in Easter Island.
  • Rongorongo differs from other scripts in that it has not yet been deciphered. 
  • Rongorongo was noted for the first time in 1864 when it was observed by Europeans.
  • Rongorongo looks very different from the European writing systems. This has led some experts to believe it may have developed locally by the inhabitants.

Source: TOI

Easter Island FAQs

Q1: What is Easter Island?

Ans: It is a Chilean dependency located in the eastern Pacific Ocean.

Q2: What is the local name of Easter Island?

Ans: It is called Rapa Nui.

Q3: Who discovered Easter Island for Europe and when?

Ans: It was discovered in 1722 by Jacob Roggeveen on Easter Sunday.

Q4: What are Moai statues?

Ans: They are large stone statues shaped like human heads, created by the Rapa Nui people.

Q5: What is Rongorongo?

Ans: Rongorongo is a system of carved symbols found on wooden tablets in Easter Island.

Union Budget 2026, Key Highlights, Constitutional Provisions, Stages

Union Budget 2026-27

The Union Budget 2026 is India’s annual financial statement presented by the Central Government that lays down plans for revenue and expenditure for the next financial year from 1 April 2026 to 31 March 2027. It is the most important financial instrument of the government, reflecting priority sectors, economic strategy, taxation policy, social welfare, and fiscal discipline.

The budget determines how India mobilises resources, spends on defence, health, education, infrastructure, and social sectors, and balances growth with fiscal prudence.

What is Union Budget of India?

The Union Budget of India is the annual financial statement of the Government of India, which presents a detailed account of the estimated revenues and expenditures of the Central Government for a particular financial year, running from 1st April to 31st March.

The Union Budget is presented every year by the Union Finance Minister in the Lok Sabha, on 1st February, and it requires approval from Parliament before implementation.

Also Read: New Income Tax Slab 2026-27

Union Budget 2026-27 PDF Download

Union Budget 2026-27 PDF presents the Government of India’s roadmap for sustained economic growth, fiscal discipline, and inclusive development under the vision of Viksit Bharat. It highlights key policy measures across manufacturing, infrastructure, agriculture, services, taxation, and social sectors with a strong focus on reform-led growth.

Download Union Budget 2026-27 Key Highlights PDF

Union Budget 2026 Highlights

Union Budget 2026 has been presented by Finance Minister Nirmala Sitharaman on 1st Februaury, 2026 (Sunday). Aligned with the Viksit Bharat@2047 vision, the budget seeks to balance fiscal discipline with strategic investments that promise strong long-term economic returns. The key highlights of the Union Budget 2026-27 has been discussed below in detail.

Rupee Comes From

Rupee Comes from 

Rupee Goes to 

Rupee Goes to

Receipts

Receipts

Expenditures

Expenditure 

1. Overall Vision and Economic Philosophy

  • The Union Budget 2026–27 is guided by the theme “Action over Ambivalence, Reform over Rhetoric, People over Populism”, aligning with the long-term vision of Viksit Bharat
  • The budget focuses on moderate inflation, sustained high growth (~7%), fiscal discipline, and macroeconomic stability, while balancing ambition with social inclusion.
  • Strong emphasis is placed on reduced import dependence, energy security, domestic manufacturing capacity, and public investment-led growth.

2. Yuva Shakti & Inclusive Growth Focus

  • The budget is Yuva Shakti-driven, targeting employment generation, skill development, and entrepreneurship for youth.
  • Priority is given to poor, underprivileged, and disadvantaged sections, reinforcing the vision of Sabka Saath, Sabka Vikas.
  • The government outlines three Kartavyas:
    • First Kartavya: Accelerate and sustain economic growth
    • Second Kartavya: Fulfil aspirations of our people
    • Third Kartavya: Vision of Sabka Saath, Sabka Vikas

3. Sustaining Momentum of Structural Reforms

  • Over 350 structural reforms have been implemented, including GST simplification, labour code notification, and quality control rationalisation.
  • High Level Committees have been formed.
  • Central Government is working with the State Governments on deregulation and reducing compliance requirements.

4. Manufacturing Push: Strategic & Frontier Sectors

  • Major schemes announced for strengthening high-value and technology-intensive manufacturing, including:

    • Revival of 200 legacy industrial clusters
    • India Semiconductor Mission (ISM) 2.0
    • Electronics Components Manufacturing Scheme
    • Biopharma SHAKTI
    • Dedicated Chemical Parks, Container Manufacturing, and Rare Earth Permanent Magnets initiatives
    • Hi-Tech Tool Rooms in CPSEs
    • Scheme for Container Manufacturing
    • Dedicated initiative for the manufacturing of affordable Sports Goods

5. Tax & Customs Reforms to Boost Manufacturing

  • Five-year income tax exemption for non-residents supplying capital goods to toll manufacturers in bonded zones.
  • Expansion of duty-free import limits for seafood, footwear, leather, and textile exporters.
  • Deferred duty payment facilities for trusted manufacturers and recognition of regular importers with trusted supply chains.
  • One-time concessional duty window for eligible SEZ manufacturing units to sell in Domestic Tariff Area

6. MSME Growth as ‘Champions’

  • Introduction of a ₹10,000 crore SME Growth Fund and ₹2,000 crore top-up to the Self-Reliant India Fund.
  • Mandatory use of TReDS by CPSEs for MSME procurement, with CGTMSE-backed credit guarantee for invoice discounting.
  • Linking GeM with TReDS to ensure faster and cheaper MSME financing.
  • Development of Corporate Mitras in Tier-II and Tier-III towns for affordable compliance support 

7. Services Sector as a Growth Engine

  • Establishment of a High-Powered Education-to-Employment Committee focusing on services.
  • Five Medical Value Tourism Hubs to be developed in partnership with states and the private sector.
  • Expansion of AYUSH infrastructure, allied health institutions, caregiver training, and AVGC creator labs.
  • Strong push to sports, design, healthcare, and the orange economy through institutional strengthening
  • Khelo India Mission - integrated talent development pathweay, systematic coaching development, intergration of science & technology and development of sports infrastructure.

8. Tourism, Education & Culture

  • Development of 15 archaeological sites into experiential destinations and a National Destination Digital Knowledge Grid.
  • Pilot upskilling of 10,000 tourist guides and setting up a National Institute of Hospitality.
  • Establishment of 5 University Townships, girls’ hostels in STEM institutions, and telescope infrastructure facilities
  • India to host the first-ever Global Big Cat Summit.
  • Development of Buddhist Circuits in the North East Region.

9. Financial Sector Reforms

  • Setting up the High Level Committee on Banking for Viksit Bharat to align with India’s next growth phase.
  • Incentive of ₹100 crore for the single issuance of municipal bonds of more than ₹1000 crore and continuation of AMRUT-linked support.
  • Introduction of market-making framework and total return swaps in corporate bonds.
  • Restructuring Power Finance Corporation (PFC) and Rural Electrification Corporation (REC).
  • Review of FEMA (Non-debt Instruments) Rules and restructuring of PFC and REC.
  • Increase in Securities Transaction Tax (STT) on futures and options 

10. Agriculture & Allied Sectors

  • Integrated development of 500 reservoirs and Amrit Sarovars.
  • Targeted programmes for fisheries, horticulture, cashew, cocoa, coconut, sandalwood, and animal husbandry.
  • Launch of Bharat-VISTAAR integrating AgriStack and ICAR practices with AI system.

11. Infrastructure & Public Capital Expenditure

  • Continued sharp rise in public capex, supported through REITs, InVITs, NIIF, and NABFID.
  • New Dedicated Freight Corridors, 20 New National Waterways, and coastal cargo promotion.
  • ₹2 lakh crore support to states under SASCI Scheme.
  • Focus on Tier-II and Tier-III city infrastructure and logistics corridors 

12. Energy Security & Climate Action

  • ₹20,000 crore for the Carbon Capture Utilization and Storage (CCUS) Scheme.
  • BCD exemptions for lithium-ion batteries, solar glass, nuclear projects (extended till 2035), and critical minerals.
  • Excise duty relief on biogas-blended CNG to promote clean energy 

13. People-Centric Development

  • Creation of a Care Ecosystem with training of 1.5 lakh caregivers.
  • Launch of SHE Marts, Divyangjan Kaushal Yojana, and Divyang Sahara Yojana.
  • Expansion of mental health institutions and trauma care centres at district hospitals
  • Supporting Artificial Limbs Manufacturing Corporation of India (ALIMCO) to scale up production of assistive devices, invest in R&D and AI integration.

14. Ease of Doing Business & Trust-Based Governance

  • Automated customs, single digital cargo clearance window, and extended validity of advance rulings.
  • Simplification of TDS/TCS, extended return filing timelines, and decriminalisation of minor tax offences.
  • MAT rationalisation and immunity schemes to encourage voluntary compliance

15. Fiscal Discipline & Deficit Targets

  • Fiscal deficit targeted at 4.3% of GDP in BE 2026–27, continuing the consolidation path.
  • Debt-to-GDP ratio projected at 55.6%, with a medium-term target of 50±1% by 2030.
  • 16th Finance Commission Recommendation: ₹1.4 lakh crore Finance Commission grants to states; vertical devolution share retained at 41%.

[youtube url="https://www.youtube.com/live/q15M7tR1obs" width="560" height="315"]

Union Budget History

India’s budgetary tradition began during the colonial era and has grown into a vital instrument guiding the country’s economic and social policies. From the first budget in 1860 to modern times, it reflects India’s evolving fiscal priorities and development goals.

  • Colonial Era Beginnings: The first budget in India was presented on 7th April 1860 by James Wilson, the first Finance Member of the Viceroy’s Council.
  • Purpose in Early Times: Initially, the budget mainly focused on revenue collection and expenditure for administration under British rule.
  • First Post-Independence Budget: After India gained independence, the first budget was presented on 26th November 1947 by R. K. Shanmukham Chetty, setting the foundation for India’s sovereign fiscal policy.
  • Evolution Over Time: The Union Budget transformed from a simple statement of revenue and expenditure to a comprehensive economic policy instrument.
  • Policy and Social Impact: Today, the budget influences economic growth, social welfare, taxation, infrastructure development, and national priorities.
  • Annual Significance: The budget is presented every year, on 1st February, marking the beginning of discussions on economic strategies for the upcoming fiscal year.
  • Modern Innovations: Over decades, the budget has incorporated reforms like digital reporting, gender budgeting, environmental considerations, and sector-specific allocations.
  • Public Engagement: With growing transparency, the budget now engages citizens, experts, and industries through detailed presentations, press releases, and live sessions.

Union Budget Constitutional Provisions

The Union Budget of India is prepared, presented, and implemented strictly according to the constitutional framework laid down in the Indian Constitution. These provisions ensure financial accountability, legislative control, and transparency in the use of public money.

Note: The term ‘budget’ is nowhere mentioned in the Constitution of India.

Union Budget Constitutional Provisions
Article Provision Explanation

Article 112

Annual Financial Statement

Mandates the presentation of the Union Budget showing estimated receipts and expenditures of the Government of India for the financial year.

Article 113

Voting on Demands for Grants

Requires Lok Sabha approval for all expenditure demands of ministries; Rajya Sabha has no voting power.

Article 114

Appropriation Bill

Authorizes withdrawal of money from the Consolidated Fund of India after demands are passed.

Article 110

Finance Bill (Money Bill)

Contains tax proposals; can be introduced only in Lok Sabha and cannot be rejected by Rajya Sabha.

Article 117

Financial Bills

Deals with bills involving expenditure from the Consolidated Fund other than Money Bills.

Article 266

Consolidated Fund of India

All revenues, loans, and repayments go into this fund; money can be withdrawn only with parliamentary approval.

Article 267

Contingency Fund of India

Used to meet unforeseen expenditure, placed at the disposal of the President.

Article 109

Role of Rajya Sabha

Rajya Sabha can only discuss the Budget and must return Money Bills within 14 days.

Article 111

Presidential Assent

Budget becomes law only after President gives assent to Appropriation and Finance Bills.

Article 116

Vote on Account

Allows government to meet expenses temporarily if Budget is not passed in time.

Stages of Budget Session in Indian Parliament

The Budget Session of the Indian Parliament is a special session conducted to discuss, scrutinize, and approve the Union Budget for the upcoming financial year. The stages of Budget Session 2026-27 have been discussed below.

  1. Presentation of the Budget: The Union Budget is presented in the Lok Sabha on 1st February every year by the Finance Minister of India. During the presentation, the Finance Minister delivers the budget speech. After the speech, the budget is formally laid before both Houses of Parliament.
  2. General Discussion: Members of the Lok Sabha discuss the budget as a whole or on any principle involved in it. However, no cut motions can be moved, and the budget is not submitted to a vote at this stage. The Finance Minister has the right to reply at the end of the discussion, clarifying policies and addressing members’ concerns.
  3. Scrutiny by Departmental Committees: Each departmental standing committee conducts an in-depth examination of the Demands for Grants of its respective ministry. This process lasts three to four weeks, during which the House remains in recess. At the end of this period, the committees submit their reports to Parliament, suggesting reductions, modifications, or reallocations if necessary.
  4. Voting on Demands for Grants: The Lok Sabha votes on the individual demands for grants of each ministry. Only Lok Sabha members can vote on these demands. Expenditure charged on the Consolidated Fund of India is excluded and does not require voting.
  5. Passing of Appropriation Bill: No money can be withdrawn from the Consolidated Fund of India except through an Appropriation Bill. This bill authorises the government to withdraw funds and meet its approved expenditures for the financial year.
  6. Passing of Finance Bill: The Finance Bill is introduced to give legal effect to the financial proposals of the government, including taxation and revenue measures, for the upcoming year. It is presented as a Money Bill under Article 110 and requires Lok Sabha approval followed by Presidential assent to become the Finance Act.

Documents Presented in Parliament Along with the Union Budget

When the Union Budget is presented in Parliament, it is accompanied by several mandatory documents that provide detailed information on government finances, allocations, and fiscal policies. These documents ensure transparency, accountability, and detailed scrutiny of government expenditure and revenue.

Budget Documents:

  • Annual Financial Statement (AFS): The primary budget document detailing the estimated receipts and expenditures of the Government of India, prepared under Article 112 of the Constitution.
  • Demands for Grants (DGs): Ministry-wise requests for funds for specific services and schemes, which must be voted upon by the Lok Sabha.
  • Finance Bill: Introduces new taxes or amendments to existing tax laws to implement the government’s revenue proposals.
  • Appropriation Bill: Authorizes the withdrawal of funds from the Consolidated Fund of India to meet expenditure approved through the budget.

FRBM Act Mandated Statements (Fiscal Responsibility and Budget Management)

  • Macro-Economic Framework Statement (MEFS): Evaluates economic growth prospects, fiscal balance, and external sector position for the upcoming year.
  • Fiscal Policy Strategy Statement (FPSS): Outlines the government’s fiscal policies and priorities for the financial year.
  • Medium-Term Fiscal Policy Statement (MTFPS): Presents medium-term fiscal targets and strategies to ensure sustainable public finances over the next 3 years.
Other Related Posts
National Income UPSC Economy Notes 2026
Inflation Monetary Policy in India
Sectors of Indian Economy Balance of Payments
Economic Growth and Development Indirect Tax
Fiscal Policy in India Financial Market
Reserve Bank of India MSME
Poverty and Developmental Issues Green GDP

Union Budget 2026 FAQs

Q1: What is the Union Budget 2026-27?

Ans: The Union Budget 2026-27 is the annual financial statement of the Government of India for the fiscal year 1st April 2026 to 31st March 2027.

Q2: Who presents the Union Budget 2026-27?

Ans: The Finance Minister of India, currently Nirmala Sitharaman, presents the budget in the Lok Sabha.

Q3: When is the Union Budget 2026-27 presented?

Ans: Union Budget 2026-27 has been presented on 1st February 2026.

Q4: Under which Article of the Constitution is the Union Budget presented?

Ans: The budget is presented under Article 112 (Annual Financial Statement) of the Indian Constitution.

Q5: What are Demands for Grants?

Ans: Demands for Grants (DGs) are ministry-wise requests for funds for specific services or schemes. The Lok Sabha votes on them to authorise spending; the Rajya Sabha can only discuss them.

Hybrid Annuity Model – New MoRTH Bidding Rules

Hybrid Annuity Model

Hybrid Annuity Model Latest News

  • The Ministry of Road Transport and Highways has tightened bidding norms for Hybrid Annuity Mode road projects by adding penalties and possible disqualification for contractors linked to major construction failures.

Hybrid Annuity Model

  • The Hybrid Annuity Model (HAM) is a public-private partnership model used mainly for road and highway projects in India. 
  • It was introduced to revive private sector participation in infrastructure after earlier models such as Build-Operate-Transfer (BOT) faced difficulties due to land delays, traffic risks, financing problems, and stressed balance sheets of developers.
  • HAM combines features of the Engineering, Procurement and Construction (EPC) model and the Build-Operate-Transfer Annuity model. 
  • Under this system, the government and the private developer share financial responsibility, while the government also takes over major revenue risks.
  • In HAM road projects, the government generally pays 40% of the project cost during the construction period
  • The remaining 60% is arranged by the private developer and is paid back by the government in the form of annuity payments during the operation period. 
  • Since toll collection risk remains with the government, the private developer is not dependent on uncertain traffic revenue.

Key Features of HAM

  • Shared financing: The government contributes 40% of the project cost during construction, reducing the initial financial burden on private developers.
  • Annuity-based repayment: The remaining amount is paid to the developer in instalments after construction, usually over the concession period.
  • Government bears traffic risk: Unlike BOT-Toll projects, the developer does not depend directly on toll collections.
  • Private sector efficiency: Construction, operation, and maintenance responsibilities remain with the private player, encouraging timely completion and better project management.
  • Performance-linked payments: Payments are linked to project milestones and maintenance standards, creating incentives for quality work.
  • Lower investment risk: Since the government assures payments, banks and financial institutions are more willing to fund such projects.

Benefits of HAM

  • Revival of PPP projects: HAM improved private participation when BOT projects became less attractive due to uncertain toll revenue and financial stress.
  • Reduced burden on government: Compared to EPC, where the government funds the full project cost, HAM allows cost sharing with private developers.
  • Lower risk for developers: Developers are protected from traffic risk, which is difficult to estimate accurately in many road projects.
  • Better bankability: Assured annuity payments improve the confidence of lenders.
  • Focus on maintenance: Since the concessionaire is responsible for operation and maintenance, roads are expected to be maintained better over time.
  • Faster infrastructure creation: HAM has supported the construction of national highways, expressways, and connectivity corridors.

Challenges in HAM Projects

  • First, it creates a long-term financial liability for the government because annuity payments must be made for years after construction. 
  • Second, if project costs are inflated at the bidding stage, the government may end up paying more over time.
  • Third, many HAM projects depend on timely land acquisition, environmental approvals, and utility shifting.  Delays in these areas increase costs and affect project execution. 

News Summary

  • The MoRTH has now introduced stricter norms for HAM tenders to prevent poor-quality construction and major structural failures. 
  • Through a circular dated April 29, 2026, MoRTH extended provisions earlier applicable to Engineering, Procurement and Construction (EPC) contracts to HAM projects.
  • The key change is the introduction of a catastrophic failure clause
    • A bidder may face a minus 30 mark penalty or possible disqualification if it has been involved in a catastrophic failure caused by construction defects in any highway project within two years before the bid due date. 
    • The rule applies to both completed and ongoing projects.
  • MoRTH has directed that these modified provisions be included in all ongoing and future HAM bid documents. 

Meaning of Catastrophic Failure

  • MoRTH has defined catastrophic failure as serious construction-related incidents that significantly affect project quality, cause loss of life, or create lasting damage to road structures. These include:
    • Collapse of a bridge, flyover, or underpass.
    • Embankment or pavement failure causing loss of serviceability.
    • Collapse of the launching girder or staging leading to loss of life during construction.
    • Tunnel collapse or trapping of people for more than 72 hours.
    • Failure of Pavement Quality Concrete.

Significance of the New Rules

  • The new norms are significant for India’s highway sector. In the last three years, major deficiencies were reported in 67 National Highway projects
  • Earlier, action against defaulting agencies included penalties, termination of agreements, blacklisting, debarment, or declaration as non-performers. The new rule adds a preventive filter at the bidding stage itself.
  • It is likely to benefit companies with strong safety systems, quality control, and clean execution records.

Source: IE | TH

Hybrid Annuity Model FAQs

Q1: What is the Hybrid Annuity Model?

Ans: It is a PPP model where the government pays 40% of road project cost during construction and the remaining amount is paid as annuity.

Q2: Why was HAM introduced in India?

Ans: HAM was introduced to revive private participation in road projects by reducing traffic and financing risks.

Q3: What is the new MoRTH rule for HAM projects?

Ans: MoRTH has introduced a penalty and possible disqualification for bidders involved in catastrophic construction failures.

Q4: What is considered a catastrophic failure?

Ans: It includes bridge collapse, flyover failure, tunnel collapse, pavement failure, or construction accidents causing loss of life.

Q5: Why are the new rules important?

Ans: They aim to improve construction quality, contractor accountability, and safety in national highway projects.

The Komagata Maru Incident (1914) – Racism, Resistance, and the Limits of Empire

The Komagata Maru Incident

The Komagata Maru Incident (1914) Latest News

  • In the early twentieth century, thousands of Punjabis sought to emigrate abroad to escape the twin crises of rural indebtedness and epidemic disease back home. 
  • As British subjects, they believed they held the right to settle anywhere within the Empire. 
  • The Komagata Maru incident (1914) shattered that illusion — and in doing so, became a defining moment in India's anticolonial consciousness.

Punjab - The Socio-Economic and Political Backdrop

  • By 1914, Punjab had been systematically cultivated by the British as a "martial race" province — the backbone of the British Indian Army. 
  • Yet beneath this loyalty lay deep structural exploitation -
    • Rapid agricultural expansion, combined with predatory credit systems, had pushed rural families into a spiral of debt.
    • Epidemics of malaria and plague in the early 1900s compounded the misery, forcing emigration as the only viable escape.
  • It was from this social soil that the Ghadar Movement emerged — founded in 1913 among expatriate Punjabis on the U.S. West Coast, it was openly committed to the armed overthrow of British rule in India. 
  • The Komagata Maru voyage was thus never merely an immigration dispute; it was saturated in anticolonial politics from the very beginning.

The Voyage and the Standoff

  • The voyage:
    • It was deliberately organised as a legal challenge to racial exclusion
    • Gurdit Singh, a Punjabi entrepreneur based in Singapore, chartered the Japanese steamship Komagata Maru and set sail from Hong Kong in the spring of 1914.
    • It had 376 passengers — 340 Sikhs, 24 Muslims, and 12 Hindus — all British subjects from Punjab.
    • Their destination was Vancouver, British Columbia, Canada, where they encountered systematic state hostility.
  • Institutional racism in immigration law: Canada had enacted the Continuous Journey Regulation of 1908, a law crafted specifically to block South Asian immigration without explicitly naming race. 
  • The two-month standoff (May–July 1914):
    • The ship reached Vancouver (May 23, 1914), but passengers were denied docking, and isolated with restricted food and water.
    • The legal challenge failed in British Columbia courts. Violent confrontation when authorities tried to board the ship.
    • Only 22 passengers — those who could prove prior Canadian residence — were permitted to enter.
    • Then Canadian PM Robert Borden ordered the ship’s expulsion using naval force. The ship departed under armed escort on July 23.

The Brutal Return - Budge Budge Massacre

  • British colonial authorities, deeply suspicious of the passengers' political leanings, refused the ship permission to dock in Hong Kong or Singapore. 
  • When the Komagata Maru finally anchored near Calcutta in late September 1914, British authorities attempted to forcibly deport passengers to Punjab. The passengers refused. 
  • They marched toward the city — and were fired upon by police. 20 passengers were killed; many more were imprisoned. 
  • Gurdit Singh escaped and remained a fugitive for years before surrendering in 1920, serving five years in prison.

Impact on Indian National Movement

  • Boost to revolutionary politics:
    • The incident intensified support for the Ghadar movement.
    • In 1915, Ghadar activists attempted an armed uprising in Punjab — it was crushed due to informers, and dozens were hanged.
    • Yet the movement’s martyrs became symbols of resistance in nationalist memory.
  • Exposure of colonial hypocrisy: Revealed that “British subjecthood” did not ensure equal rights across the Empire. Strengthened anti-colonial consciousness and distrust of imperial promises.
  • Diaspora politics and anticolonial nationalism: The Ghadar movement represents an important strand of overseas Indians contributing to India's independence struggle.

Canada’s Delayed Reckoning

  • Canada's acknowledgement of its role was painfully delayed.
    • In 2008, Prime Minister Stephen Harper offered an apology at a community festival — widely rejected as inadequate.
    • It was only in 2016 that Prime Minister Justin Trudeau delivered a formal apology on the floor of the House of Commons, more than a century after the events.
  • The episode is now seen as a critical moment in Canada’s journey toward acknowledging systemic racism and exclusion.

Conclusion

  • The Komagata Maru incident is more than a story of a failed migration—it is a powerful indictment of colonial injustice and racial exclusion. 
  • For modern governance and global migration debates, it remains a cautionary tale about equality, dignity, and the limits of legal rights without social justice.

Source: TH

The Komagata Maru Incident (1914) FAQs

Q1: How did the Komagata Maru incident expose the contradictions of British imperial citizenship?

Ans: It revealed that “British subject” status did not guarantee equal rights, as racial discrimination overrode legal equality.

Q2: What is the role of Punjab’s socio-economic conditions in shaping the Komagata Maru episode?

Ans: Agrarian distress, indebtedness, and epidemics in Punjab pushed migration, forming the socio-economic base of the voyage.

Q3: What is the significance of the Komagata Maru incident in the growth of revolutionary nationalism in India?

Ans: It strengthened anti-colonial sentiment and boosted recruitment and legitimacy of the Ghadar Movement.

Q4: What is the role of colonial laws in shaping migration patterns during the early 20th century?

Ans: Discriminatory laws like Canada’s continuous journey regulation institutionalised racial exclusion and restricted Indian migration.

Q5: What lessons does the Komagata Maru incident offer for contemporary migration and multicultural policies?

Ans: It underscores the need for inclusive, non-discriminatory immigration systems and acknowledgment of historical injustices.

Ambedkar Labour Laws: How Ambedkar Labour Laws Shaped Modern India

Ambedkar Labour Laws

Ambedkar Labour Laws Latest News

  • As India observed Dr. B.R. Ambedkar's birth anniversary on April 14, this article highlights a lesser-known but profoundly important dimension of his legacy — his transformative contributions to labour rights and welfare in colonial India.

Ambedkar's Vision for Labour — Beyond Survival

  • Ambedkar began his political journey by organising the Independent Labour Party to address the issues of the working classes in colonial India. However, his vision went far beyond material conditions. 
  • For Ambedkar, labour must be able to live a life of self-development of their human, cultural, and spiritual personalities — not merely survive. 
  • This philosophical foundation shaped every labour reform he pursued.

Ambedkar as Labour Member (1942-46) — A Watershed Moment

  • The early 1940s were a turbulent period. 
  • Industrialisation was expanding across the Global South — including colonial India — pushing vast masses from agrarian, feudal setups into a labour-driven capitalist economy. 
  • Little to no attention was paid to labour rights, on the assumption that early industrialisation could not afford to accommodate worker protections. 
  • Against this backdrop, Ambedkar's appointment as Labour Member in the Viceroy's Executive Council in 1942 — nearly a month before the launch of the Quit India Movement — marked a watershed moment for Indian labour.

Key Labour Reforms Introduced by Ambedkar

  • Ambedkar introduced a remarkable range of pathbreaking legislation during his four-year tenure:
    • Reduction of working hours from 12 hours to 8 hours per day — moving India toward the global norm of a 48-hour workweek.
    • Maternity benefits for women workers — ensuring women did not have to choose between livelihood and childbirth.
    • Provident Fund for workers.
    • Paid leave and Dearness Allowance (DA).
    • Compulsory recognition of trade unions.
    • Housing and medical facilities for workers.
    • Creation of Employment Exchanges.
    • Employee State Insurance (ESI) — laying the foundation for social security in India.
  • Ambedkar made clear that reducing working hours was not just about health and dignity — it could also address unemployment by distributing work more evenly, without any reduction in wages or dearness allowance.

Tripartite Labour Conference, 1942 — A Historic First

  • In 1942, Ambedkar chaired the first-ever Tripartite Labour Conference in India — bringing together the government, employers, and employees to discuss common problems jointly. 
  • Ambedkar ensured that labour and management were brought face-to-face as equals — a new paradigm in India's industrial relations.
  • The conference also raised an important debate about placing labour legislation in the Concurrent List of the Constitution, ensuring national uniformity in labour laws rather than allowing individual provinces to enact varying laws driven by local interests. 
  • Ambedkar warned that without central legislation, "Provincial considerations" would dominate over national importance. 
  • These conferences met regularly from 1942 to 1946 and shaped the future of India's labour policy.

Labour Investigation Committee, 1944

  • Under Ambedkar's initiative, the Labour Investigation Committee was formed in early 1944 — the first fact-finding body of its kind in India. 
  • It examined critical aspects of labour life including wages, working conditions, housing, and broader social realities — going beyond industries like coal and cotton to sectors that had been previously neglected. 

Sector-Specific Welfare Measures

  • Ambedkar's 1943 visit to Chota Nagpur to witness the lives of mine workers directly translated into policy. 
  • He introduced a Bill that led to the establishment of the Mica Mines Labour Welfare Fund in 1946 — the first of its kind. 
    • This model was subsequently extended to workers in coal, iron ore, manganese, limestone, dolomite, and the beedi industry.

Dignity in the Workplace

  • In 1946, Ambedkar pushed for an amendment requiring mine owners to provide separate bathing facilities for male and female workers — arguing that miners deserved to return home clean and with a sense of self-respect and dignity, not merely hygiene. 
  • This reflected his belief that labour rights were inseparable from human dignity.

Ambedkar's Labour Legacy in the Constitution

  • Key constitutional provisions reflecting his vision include:
    • Article 39 — Directs the State to ensure adequate means of livelihood for all citizens and equal pay for equal work for men and women.
    • Article 43 — Directs the State to secure for all workers — agricultural, industrial, or otherwise — a living wage, decent working conditions, and full enjoyment of leisure, social and cultural opportunities.
    • Article 39(b) and (c) — Seeks to eliminate economic inequality by ensuring that ownership and control of material resources serve the common good, and that concentration of wealth does not occur to the common detriment.

Ambedkar's Broader Philosophy on Labour Rights

  • Ambedkar was clear on one fundamental point — labour rights cannot survive on reforms alone. 
  • Trade unionism, while important, was not sufficient. He strongly believed that for workers to sustain the rights they had achieved, they must have representation in the politics of the country. 
  • Labour must enter political life and find solutions beyond the workplace — a vision that was far ahead of its time.

Source: IE

Ambedkar Labour Laws FAQs

Q1: What are Ambedkar labour laws?

Ans: Ambedkar labour laws refer to reforms introduced by B. R. Ambedkar, including the 8-hour workday, social security, and labour welfare measures during colonial India.

Q2: Why are Ambedkar labour laws significant?

Ans: Ambedkar labour laws laid the foundation for modern labour rights in India, ensuring dignity, fair wages, and improved working conditions for industrial and agricultural workers.

Q3: What reforms were included in Ambedkar labour laws?

Ans: Ambedkar labour laws included maternity benefits, provident fund, employee insurance, paid leave, trade union recognition, housing, and employment exchanges.

Q4: How do Ambedkar labour laws influence the Constitution?

Ans: Ambedkar labour laws are reflected in Articles 39 and 43, which promote equal pay, livelihood security, living wages, and decent working conditions.

Q5: What was Ambedkar’s philosophy behind labour laws?

Ans: Ambedkar labour laws were based on dignity and holistic development, emphasising that workers deserve social, cultural, and political empowerment beyond economic survival.

Italy

Key Facts about Italy

Italy Latest News

Recently, India and Italy unveiled a bilateral military cooperation plan 2026-27 outlining the military engagements between the armed forces of both the countries.

About Italy

  • Location: It is located in South-central Europe on the Apennine Peninsula.
  • Bordering Countries: It shares its border with Switzerland and Austria in the north, Slovenia in the northeast and France in the northwest.  
    • Vatican City and San Marino are the two enclaved sovereign states within Italy.
  • Maritime boundaries: It is bordered by the Adriatic Sea in the east, the Sea of Sicily in the south, the Ionian Sea in the southeast, the Ligurian Sea, and the Tyrrhenian Sea in the southwest.
  • Capital City: Rome

Geographical Features of Italy

  • Terrain: It is mostly rugged and mountainous and has some plains, coastal lowlands.
  • Major Rivers: Po (It is Italy’s longest river) and Adige
  • Highest Point: Mont Blanc 
  • Volcano: Italy is volcanic in origin, and a few of its many volcanoes are active, including Sicily’s Mt. Etna, Stromboli in the Aeolian Islands.
  • Natural Resources: Coal, antimony, mercury, zinc, potash, barite, asbestos, pumice, fluorspar, feldspar, pyrite (sulfur), natural gas and crude oil reserves.

Source: DH

Italy FAQs

Q1: What is the capital of Italy?

Ans: Rome

Q2: Which mountain range runs through Italy?

Ans: Apennines

International Labour Day 2026, History, Significance

International Labour Day

International Labour Day 2026

  • International Labour Day, also known as May Day, is observed annually on May 1 to honor the dedication and contributions of workers across the globe.
  • It is a memorial to the labor movement's struggles and victories.
  • History:
    • The origins of International Labor Day are found in Chicago, where on May 1, 1886, workers called for a strike for an eight-hour workday.
    • The protest, which turned into what is now remembered as the Haymarket Affair, was a turning point in labor history.
    • On May 4, violence broke out in Haymarket Square when a bomb was thrown at police officers. 
    • The resulting gunfire resulted in several deaths, including six officers and a number of civilians.
    • This turning point stimulated trade unions and socialist federations across Europe to declare May 1 an international day of workers' solidarity, formally approved in 1889 at the Paris meeting of the Second International.
  • While International Labour Day commemorates events in the United States, both the US and Canada observe Labour Day on the first Monday of September, not May 1.
  • Over 80 countries, including India, Cuba, and China, mark International Labour Day.
  • In India, the first Labour Day celebration was held in Chennai (then Madras) in 1923 by the Labour Kisan Party of Hindustan.
  • The day usually involves parades, union gatherings, and celebrations that emphasize employee rights.

International Labour Day 2026 Significance

The key significance of International Labour Day 2026 has been highlighted below:

  • International Labour Day 2026 recognizes and honors the contributions of workers to economic and social development.
  • Commemorates the Haymarket Affair, which led to the demand for an 8-hour workday.
  • Promotes awareness about workers’ rights such as fair wages, safe working conditions, and job security.
  • Highlights issues like unemployment, labour exploitation, child labour, and workplace inequality.
  • Encourages unity and solidarity among workers, trade unions, and organizations.
  • Reminds governments to enforce labour laws and ensure social justice.
  • Reflects the importance of dignity of labour in society.
  • Gains relevance in modern times due to challenges like gig economy, contract jobs, and automation.
  • In India, it is observed through rallies, campaigns, and awareness programs supporting workers’ welfare.
 

International Labour Day 2026 FAQs

Q1: When is International Labour Day observed?

Ans: May 1

Q2: In which year did the Second International declare May 1 as International Workers' Day?

Ans: 1889

Q3: Where in India was Labour Day first celebrated in 1923?

Ans: Chennai

Delimitation Commission, Constitutional Provisions, Members, Objectives

Delimitation Commission

The Delimitation Commission is a statutory body constituted by the Union Government to redraw the boundaries of Lok Sabha and State Assembly constituencies based on Census data, ensuring equal representation. Its formation is guided by Articles 82 and 170, with Articles 330 and 332 covering SC/ST seat reservations. The Commission is chaired by a retired Supreme Court judge, with the Chief Election Commissioner and State Election Commissioners as members.

Delimitation Commission

The Delimitation Commission is a statutory and quasi-judicial body established by the Government of India to redraw the boundaries of Lok Sabha and State Assembly constituencies based on the latest Census. This process ensures that each constituency represents roughly equal population size, maintaining the principle of democratic equality. The Commission’s decisions are final, have the force of law, and cannot be challenged in any court, ensuring independence and integrity in the process.

Delimitation Commission Constitutional Provisions

India’s Constitution contains detailed provisions to ensure population-based representation. These provisions guide how Parliament and the Commission undertake delimitation.

Delimitation Commission Constitutional Provisions
Article Provision

Article 82

Parliament to enact a Delimitation Act after every Census.

Article 170

Readjustment of State Legislative Assembly seats after every Census.

Articles 330 & 332

Reservation of seats for SCs and STs based on population proportion.

Article 327

Parliament’s power to make laws regarding elections.

Article 329(a)

Delimitation orders cannot be challenged in any court.

Delimitation Commission Members

The Delimitation Commission consists of a retired Supreme Court judge as the Chairperson, along with the Chief Election Commissioner and State Election Commissioners as members. This structure ensures neutrality and legal oversight in redrawing constituency boundaries. Associate Members (MPs/MLAs) may participate, but the final authority rests solely with the Commission.

Chairperson: Retired Judge of the Supreme Court
Member: Chief Election Commissioner (CEC) of India
Members: State Election Commissioners of concerned states

Associate Members: Selected MPs/MLAs (consultative only, no voting power)
Decisions: Final and legally binding; cannot be challenged in court

Delimitation Commission Objectives & Functions

The primary objective of the Delimitation Commission is to ensure fair and equal representation by redrawing constituency boundaries based on the latest population data. It aims to correct population imbalances, allocate seats proportionately for SC/ST communities, and improve the administrative coherence of electoral divisions.

Objectives

  • Ensure equal population representation across constituencies.
  • Allocate SC/ST reserved seats as per their population proportion.
  • Maintain electoral fairness by preventing over- or under-representation.
  • Promote balanced federal representation among states.

Functions

  • Redraw boundaries of Lok Sabha and State Assembly constituencies.
  • Fix the total number of seats allocated to each state.
  • Determine SC/ST seat reservation based on Census data.
  • Ensure compact, contiguous, and administratively coherent constituencies.
  • Publish draft proposals, invite public objections, and finalise orders.
  • Implement seat rotation for reserved constituencies where applicable.

Delimitation Acts in India

The Delimitation Acts provide the legal framework for periodically redrawing Lok Sabha and State Assembly constituencies based on Census data. These Acts ensure equal population representation, update SC/ST reserved seats, and maintain electoral fairness across states. India has enacted four major Delimitation Acts in 1952, 1962, 1972, and 2002, each corresponding to a national Census and leading to the formation of a Delimitation Commission

Delimitation Acts in India
Delimitation Act Year of Commission Census Used Key Features

Delimitation Act, 1952

1952

1951 Census

First Delimitation Commission; created initial LS & Assembly constituencies; set SC/ST reserved seats.

Delimitation Act, 1962

1963

1961 Census

Redefined constituencies based on population changes; ensured updated SC/ST reservation.

Delimitation Act, 1972

1973

1971 Census

Third Commission; boundaries readjusted; total seats later frozen by 42nd Amendment (1976).

Delimitation Act, 2002

2002

2001 Census

Fourth Commission; updated boundaries & reserved seats; total seats unchanged due to freeze until 2026.

Delimitation Commission Amendments

Delimitation in India has been influenced by key constitutional amendments aimed at ensuring fair representation while encouraging population control. These amendments froze or adjusted the number of seats and guided the process of redrawing constituency boundaries. Major changes were brought by the 42nd, 84th, and 87th Amendments, which continue to shape delimitation today.

  • 42nd Amendment (1976): Froze total Lok Sabha and Assembly seats until 2001 to promote population control.
  • 84th Amendment (2002): Extended the freeze until 2026 and allowed internal readjustments using the 1991 Census.
  • 87th Amendment (2003): Mandated use of the 2001 Census for SC/ST seat allocation and constituency rationalisation.
  • Impact: Ensures stability in seat allocation but delays adjustment to reflect population changes.

Criteria Used for Delimitation of Constituencies

Delimitation of constituencies is guided by clear criteria to ensure fair representation, administrative efficiency, and electoral equity. The process considers population distribution, geographic contiguity, natural and administrative boundaries, and the proportion of SC/ST population for reserved seats.

  • Population Equality: Each constituency should represent roughly the same number of people.
  • Geographical Compactness: Constituencies must be contiguous and not fragmented.
  • Natural Boundaries: Rivers, hills, and other natural features are considered while drawing boundaries.
  • Administrative Convenience: Districts, blocks, and tehsils should not be unnecessarily split.
  • SC/ST Representation: Reserved seats are allocated in proportion to the SC/ST population in the area.
  • Public Feedback: Draft proposals are published for objections before finalisation.

International Practices Related to Delimitation

Delimitation, or the redrawing of electoral boundaries, is practiced worldwide to ensure fair and equal representation. Different countries adopt various methods, including independent commissions, proportional representation, and legal safeguards to prevent gerrymandering.

International Practices Related to Delimitation
Country Delimitation/Redistricting Authority Key Features

USA

State legislatures, some with independent commissions

Boundaries redrawn every 10 years after Census; gerrymandering is a major concern.

UK

Boundary Commissions

Independent commissions review and propose boundaries; public consultations are mandatory.

Canada

Independent Electoral Boundaries Commissions

Boundaries reviewed every 10 years; transparency and population equality emphasized.

Australia

Australian Electoral Commission (Independent)

Uses strict population quotas; public objections invited; legal challenges allowed.

South Africa

Independent Electoral Commission

Reviews boundaries before general elections; ensures minority and regional representation.

Lessons for India

  • Use independent commissions to reduce political bias.
  • Ensure public consultation and transparency in the delimitation process.
  • Maintain strict population equality with flexibility for geography and administrative convenience.
  • Consider minority representation to protect marginalised communities.

Impact of Delimitation on Political Representation

Delimitation significantly influences political representation by adjusting constituency boundaries to reflect population changes. It ensures that each vote has roughly equal value, enhances fair representation for SC/ST communities, and can alter the political strength of parties across regions.

  • Equal Representation: Balances voter population across constituencies, upholding the principle of “one person, one vote.”
  • SC/ST Reservation Adjustment: Ensures reserved seats reflect current demographic proportions.
  • Shift in Political Power: States or regions may gain or lose influence based on population changes.
  • Effect on Party Strongholds: Traditional strongholds may be altered, influencing election outcomes.
  • Administrative Efficiency: Constituencies become more manageable, improving governance and electoral management.
  • Federal Balance: Adjusts representation among states, preserving equity in Parliament and Assemblies.

Impact of Delimitation on Southern & North-Eastern States

Delimitation has had a significant impact on Southern and North-Eastern states due to differences in population growth compared to the national average. Southern states, which successfully implemented population control measures, retained fewer parliamentary seats relative to their population, while North-Eastern states often maintained smaller constituencies due to geographic and administrative considerations.

Southern States (e.g., Kerala, Tamil Nadu, Karnataka, Andhra Pradesh)

  • Population control led to smaller seat share relative to Northern states despite stable population growth.
  • Political influence in Lok Sabha remains limited due to fixed seat allocation under the freeze (until 2026).
  • Encouraged efficient constituency management with relatively smaller populations per seat.

North-Eastern States (e.g., Nagaland, Manipur, Mizoram, Meghalaya)

  • Constituencies are smaller in population due to difficult terrain and scattered settlements.
  • Seat allocation ensures regional representation despite low population density.
  • Helps preserve minority and tribal representation, maintaining political and cultural inclusivity.

Delimitation Commission Issues

Delimitation faces challenges such as population imbalances, unequal constituency sizes, and political resistance from states fearing loss of seats. Delays and outdated boundaries also affect fair representation and SC/ST seat allocation.

  • Population Imbalance Across States: Southern states successfully controlled population growth, while Northern states have higher growth, creating disparities in representation. The freeze on seats until 2026 prevents proportional adjustment based on current population.
  • Political Sensitivity and Resistance: States fearing loss of seats or political influence often resist delimitation. Redistribution of constituencies may alter party strongholds, causing political friction.
  • Unequal Constituency Sizes: Northern states like Uttar Pradesh have overpopulated constituencies, while North-Eastern states have very small populations per seat. This affects voter equality, with some votes carrying more weight than others.
  • Delayed Delimitation: Lack of regular delimitation results in stale constituency boundaries that no longer reflect demographic realities.
  • SC/ST Reservation Issues: Reserved constituencies for Scheduled Castes and Tribes may not reflect current population distribution, leading to under- or over-representation.
  • Geographical and Administrative Challenges: North-Eastern states and hill regions pose terrain and accessibility challenges, complicating boundary rationalization.

Delimitation Commission Way Forward

To ensure fair and equitable representation, delimitation should be conducted after 2026 using the latest Census data. Greater use of technology, periodic reviews, public consultation, and special attention to Southern and North-Eastern states can enhance transparency, accuracy, and political equity.

  • Conduct delimitation using the latest Census post-2026.
  • Implement periodic delimitation every 10 years.
  • Use GIS and digital mapping for precise boundaries.
  • Ensure public participation and transparency.
  • Protect representation for states with population control.
  • Consider terrain, accessibility, and tribal representation in the North-Eastern and hill regions.

Delimitation Commission UPSC Prelims PYQs

Que. How many Delimitation Commissions have been constituted by the Government of India till December 2023? [UPSC Prelims 2024]

a). One

b). Two

c). Three

d). Four

Ans d Four

Explanation: Delimitation Commissions have been established under the Delimitation Acts of 1952, 1962, 1972, and 2002, leading to commissions being set up in 1952, 1963, 1973, and 2002. Notably, no commissions were created following the 1981 and 1991 Censuses due to political considerations and a nationwide freeze on seat allocation aimed at encouraging population control, which was first introduced by the 42nd Amendment (1976).

The process also considers the reservation of seats for Scheduled Castes (SCs) and Scheduled Tribes (STs) as mandated by Articles 330 and 332 of the Constitution, ensuring proportional representation based on population. Delimitation has a direct impact on political representation, electoral competitiveness, and federal balance among states, making it a crucial mechanism in India’s democratic framework. The next major delimitation is expected after 2026, once the freeze on seat allocation ends, potentially reshaping political dynamics across the country.

Delimitation Commission FAQs

Q1: What is the Delimitation Commission?

Ans: A statutory body constituted by the Union Government to redraw Lok Sabha and State Assembly constituency boundaries based on Census data.

Q2: Under which constitutional provisions does it function?

Ans: Articles 82 and 170 (delimitation) and Articles 330 and 332 (SC/ST reservations).

Q3: Who are the members of the Commission?

Ans: Chairperson (retired Supreme Court judge), Chief Election Commissioner, State Election Commissioners, and Associate MPs/MLAs (consultative role).

Q4: Are its orders legally binding?

Ans: Yes. Under Article 329(a), its decisions cannot be challenged in any court.

Q5: When was the last delimitation conducted?

Ans: Between 2002 and 2008, based on the 2001 Census.

Fiscal Responsibility & Budget Management (FRBM) Act, Objectives

Fiscal Responsibility & Budget Management (FRBM) Act

The Fiscal Responsibility and Budget Management (FRBM) Bill was introduced in 2000 by the Atal Bihari Vajpayee government to give legal shape to the idea of fiscal discipline in India. It aimed to bring accountability and transparency to government finances. The bill became law in 2003, marking a major shift in how public funds were to be managed. The FRBM Act 2003 set specific targets for reducing fiscal deficits, improving financial management, and promoting long-term fiscal stability.

Fiscal Responsibility & Budget Management (FRBM) Act

The Fiscal Responsibility & Budget Management Act, 2003 (FRBMA), is a law enacted by the Indian Parliament to enforce principles of sound financial management and keep fiscal deficits under control. Its core aim is to ensure a balanced budget and promote fiscal discipline.

The Act initially targeted eliminating the revenue deficit and capping the fiscal deficit at 3% of GDP by March 2008. However, the 2007 global financial crisis forced the government to delay and eventually suspend these targets in 2009. In 2011, as the economy began recovering, the Economic Advisory Council recommended revisiting the FRBM framework. A review committee, chaired by N. K. Singh, set up under the Ministry of Finance, was later tasked with evaluating and updating the Act’s provisions.

Fiscal Responsibility & Budget Management (FRBM) Act Needs

In May 2016, the government appointed N. K. Singh to head a committee to review the Fiscal Responsibility and Budget Management (FRBM) Act. The committee recommended a phased reduction in the fiscal deficit starting with a target of 3% of GDP by March 2020, then lowering it to 2.8% in 2020-21, and further to 2.5% by 2022-23.

During COVID-19 pandemic, the economic slowdown and increased spending on welfare and healthcare led to a major revenue shortfall. As a result, the government recorded a fiscal deficit of 9.2% of GDP in FY21, slightly better than the revised estimate of 9.5%. For FY22, the deficit target was scaled down to 6.8%, with a longer-term goal of bringing it down to 4.5% by FY26.

The FRBM Act, 2003 is designed not just to limit deficits but also to improve transparency in fiscal management of India. Over the long term, it aims to achieve budgetary stability while giving the Reserve Bank of India (RBI) the space it needs to manage inflation effectively.

Fiscal Responsibility & Budget Management (FRBM) Act Objectives

The Fiscal Responsibility and Budget Management (FRBM) Act, passed by the Indian Parliament in 2003, was a significant step toward institutionalizing financial discipline in the country. Its core objective is to ensure responsible fiscal management by reducing the fiscal deficit and improving the quality of macroeconomic governance. The key goals of the Act can be understood across four broad themes:

  • The FRBM Act mandates specific targets to bring down the fiscal deficit, revenue deficit, and total government debt as a percentage of GDP. 
  • To promote openness in fiscal operations, the FRBM Act requires the government to present documents such as the Medium-Term Fiscal Policy Statement, Fiscal Policy Strategy Statement, and Outcome Budget to Parliament. 
  • The FRBM Act aims to reduce inflationary pressures and maintain a stable macroeconomic environment. 
  • One of the Act’s long-term aims is to prevent the economy from falling into a debt trap by ensuring that debt levels remain within sustainable limits.

Fiscal Responsibility & Budget Management (FRBM) Act Features

To achieve the objectives, Fiscal Responsibility & Budget Management (FRBM) Act Features were incorporated which are mentioned below:

  • The FRBM Act sets limits on fiscal deficit and revenue deficit, expressed as a percentage of GDP. Initially, the Act aimed to reduce the fiscal deficit to 3% of GDP by 2008. These targets are periodically updated based on economic needs and government priorities. 
  • Under the FRBM Act, the central government is mandated to present three critical fiscal documents every financial year: the Medium-Term Fiscal Policy Statement, the Fiscal Policy Strategy Statement, and the Macroeconomic Framework Statement. 
  • Each year, the government outlines specific fiscal goals and performance determiners in line with FRBM principles.
  • The FRBM Act is not static, it includes a built-in review mechanism. This means fiscal targets can be reassessed and modified based on changing economic conditions.

FRBM Act Escape

The FRBM Act Escape allows the government to exceed the fiscal deficit target in case of extraordinary circumstances which includes war, natural calamity, severe economic downturn or other significant events beyond control. While this provides flexibility and the government is expected to return to the fiscal path once the crisis passes. Even when invoked, the government must justify the deviation and lay out a path to correction.

Fiscal Responsibility & Budget Management (FRBM) Act Advantages

  • FRBM Act sets legal limits on fiscal and revenue deficits, discouraging excessive borrowing and forcing the government to prioritize essential spending. 
  • Mandates regular reports like the Medium-Term Fiscal Policy and Fiscal Strategy Statements. These documents provide reliable insights into government finances, helping stakeholders plan based on data rather than guesswork.
  • By keeping deficits under control, the Act helps reduce inflationary pressure, stabilizes interest rates, and avoids crowding out private investment which creates a more stable environment for long-term economic growth.
  • Transparent and rule-based fiscal policy enhances the government's credibility. It attracts both domestic and foreign investors, strengthens market confidence, and supports better sovereign credit ratings.

Fiscal Responsibility & Budget Management (FRBM) Act Issues

  • Though the FRBM Act Escape clause allows deviation from targets during unforeseen circumstances, frequent use undermines the Act’s credibility. It raises doubts about the government’s commitment to long-term fiscal discipline.
  • Strict fiscal targets may limit necessary investments in critical sectors like health, education, and infrastructure. This can hurt long-term growth and weaken efforts to improve social outcomes.
  • The success of the Act relies on strong institutions and political commitment. Inconsistent implementation across different governments and regimes hampers its effectiveness and enforcement.

Fiscal Responsibility & Budget Management (FRBM) Act FAQs

Q1: What is the FRBM Act?

Ans: A law to ensure responsible fiscal management by reducing fiscal deficits and promoting transparency in India's financial operations.

Q2: When was the FRBM Act passed?

Ans: The FRBM Act was enacted in 2003 by the Indian Parliament.

Q3: What is the main objective of the FRBM Act?

Ans: To reduce fiscal deficit, eliminate revenue deficit, and ensure macroeconomic stability.

Q4: Who implements the FRBM Act?

Ans: The Ministry of Finance, under the Government of India.

Q5: What are fiscal and revenue deficits?

Ans: Fiscal deficit is excess expenditure over income; revenue deficit is excess revenue spending over revenue receipts.

List of Government Schemes in India, Objectives, Impacts

Important Government Schemes

Government Schemes are a foundational element of UPSC CSE Exam 2026 preparation, as they play a major role in the nation’s developmental priorities and the execution of public policy. Spanning across various sectors such as health, education, agriculture, and the economy, these Important Government Schemes provide insights into governance frameworks, social inclusion, and public service delivery framework. Questions related to government initiatives are frequently asked across the Prelims, Mains, and Interview stages of the UPSC Exam 2026.

Government Schemes for UPSC CSE Exam 2026 Prelims

In Prelims, UPSC often has factual questions about the Important Government Scheme. Aspirants must know the launch year, objectives, implementing ministry, beneficiaries, and key features of Important Government Schemes. Focus should be on those featured in the Union Budget, Economic Survey, and PIB updates from the past two years. Schemes like PM-KISAN, Ayushman Bharat, or PM Gati Shakti have often appeared. 

Government Schemes for UPSC CSE Exam 2026 Mains

In Mains, especially in GS Paper II (Governance, Social Justice) and GS Paper III (Economy, Environment), Important Government Schemes are used to support arguments and showcase awareness. Topics like rural development, women empowerment, MSMEs, and health require references to relevant schemes. Writing answers with examples like MGNREGA, Beti Bachao Beti Padhao, or Jal Jeevan Mission adds credibility. 

Government Schemes for UPSC CSE Exam 2026 Interview

In Interview stage, during the UPSC CSE Exam 2026 often evaluates the understanding of ongoing government initiatives and their real-world impact. Questions may be asked about schemes related to home states, optional subjects, or academic background. Knowledge of schemes like Aspirational Districts Programme or Ayushman Bharat helps form informed opinions. Referring to Government Schemes also reflects your awareness of national development issues and policy implementation, which can leave a strong impression on the board.

Government Schemes for UPSC Importance

  1. Important Government Schemes are directly linked to topics in GS Paper II (Governance, Social Justice) and GS Paper III (Economy, Environment, Agriculture, Infrastructure).
  2. UPSC regularly asks factual questions about schemes, launch year, objectives, ministry, and features making them important areas for Prelims.
  3. Citing Important Government Schemes in Mains answers adds credibility, relevance, and depth to your arguments, especially in topics like rural development, health, and employment.
  4. Important Government Schemes reflect governance values like transparency, accountability, and social justice making them valuable in Ethics and Essay papers.
  5. Government Schemes are frequently covered in PIB, Yojana, Budget, and Economic Survey, making them an essential part of dynamic preparation.
  6. Understanding Important Government Schemes shows your awareness of real-world policy implementation, especially during discussions on your home state or optional subject.
  7. The Important Government Schemes provide insights into how the government tackles national challenges such as poverty, education, health, infrastructure, etc. through targeted interventions.

How to Study Government Schemes for UPSC

To study Government Schemes for UPSC effectively, first categorize them under GS Papers, e.g., health under GS II, economy under GS III. Refer to authentic sources such as PIB, Yojana, Kurukshetra, and the official portals of relevant ministries. Focus on the objectives, launch year, key features, budgetary allocation, challenges, and impact. Create mind maps, flowcharts, and comparative tables for revision. Practice MCQs and answer writing based on schemes for better elaboration.

Important Government Schemes List for UPSC

Below in the table including newly launched and strategically Important Government Schemes relevant for UPSC Exam 2026:

Important Government Schemes for UPSC

Scheme Name

Launch Date

Department

Key Features

Budget

Beneficiaries

Completion Date

PM Awas Yojana

2015

Ministry of Housing & Urban Affairs

Affordable housing for all by 2022

₹6.85 lakh crore

Urban and rural poor

2022

Model Skill Loan Scheme

2015

Ministry of Skill Development

Provides loans for skill development courses

N/A

Students pursuing skill development

Ongoing

Mudra Yojana

2015

Ministry of Finance

Financial support to small businesses

₹3 lakh crore

Small entrepreneurs

Ongoing

PMGSY (Pradhan Mantri Gram Sadak Yojana)

2000

Ministry of Rural Development

Rural road connectivity

₹1.8 lakh crore

Rural population

Ongoing

Urban 2.0 Initiative

2021

Ministry of Housing & Urban Affairs

Urban renewal and smart city development

₹2.05 lakh crore

Urban residents

Ongoing

PM Vishwakarma Scheme

2023

Ministry of MSME

Skill enhancement for traditional artisans

₹13,000 crore

Traditional artisans

Ongoing

Amrit Bharat Station Scheme

2023

Ministry of Railways

Redevelopment of railway stations

₹10,000 crore

Railway passengers

2025

Mission LiFE (Lifestyle for Environment)

2022

Ministry of Environment

Promoting sustainable living practices

N/A

General public

Ongoing

National Logistics Policy (NLP)

2022

Ministry of Commerce & Industry

Improve efficiency in logistics sector

N/A

Logistics companies

Ongoing

PM Gati Shakti National Master Plan

2021

Ministry of Commerce & Industry

Integrated infrastructure planning

₹100 lakh crore

Infrastructure sector

2025

PM Schools for Rising India (PM SHRI)

2022

Ministry of Education

Strengthen schools with modern facilities

₹27,360 crore

Students and educators

2026-27

Rashtriya Udyamita Vikas Pariyojana

2024

Ministry of Skill Development

Entrepreneurship development for youth

N/A

Young entrepreneurs

Ongoing

Pradhan Mantri Janjatiya Unnat Gram Abhiyan

2024

Ministry of Tribal Affairs

Development of tribal villages

₹7,000 crore

Tribal communities

2026

Vatsalya Scheme

2024

Ministry of Women & Child Development

Child welfare and protection

N/A

Children in need

Ongoing

Purvodaya

2024

Ministry of Steel

Boosting Eastern India's steel sector

N/A

Steel industry

2030

Pradhan Mantri Surya Ghar Yojana

2024

Ministry of New & Renewable Energy

Solar energy adoption in households

₹75,000 crore

Residential households

2027

Electric Mobility Promotion Scheme

2024

Ministry of Heavy Industries

Promotion of electric vehicles

₹10,000 crore

EV manufacturers and buyers

2030

Pradhan Mantri Swasthya Suraksha Nidhi

2021

Ministry of Health & Family Welfare

Health infrastructure funding

₹64,180 crore

Health institutions

Ongoing

Ayushman Bharat Pradhan Mantri Jan Aarogya Yojana

2018

Ministry of Health & Family Welfare

Health insurance for the poor

₹64,180 crore

Low-income families

Ongoing

National Digital Health Mission

2020

Ministry of Health & Family Welfare

Digital health records for all citizens

₹1,600 crore

General public

Ongoing

Pradhan Mantri Swasthya Suraksha Yojna

2006

Ministry of Health & Family Welfare

Establish AIIMS-like institutions across India

₹14,970 crore

Medical students, patients

Ongoing

Intensified Mission Indradhanush 3.0

2021

Ministry of Health & Family Welfare

Immunization drive for children and pregnant women

N/A

Children and pregnant women

Ongoing

STARS Project

2020

Ministry of Education

Strengthening teaching-learning outcomes

$500 million (World Bank)

School students

2025

Institutions of Eminence Scheme

2018

Ministry of Education

Promote world-class higher education institutions

₹10,000 crore

Universities

Ongoing

Mid-Day Meal

1995

Ministry of Education

Free meals to school children

₹11,000 crore

School students

Ongoing

Swach Vidyalaya Abhiyan

2014

Ministry of Education

Build separate toilets for boys and girls in schools

N/A

School students

Completed 2019

Kala Utsav

2015

Ministry of Education

Promote art and cultural activities in schools

N/A

School students

Ongoing

Shikshav Parv Initiative

2020

Ministry of Education

Discuss and implement NEP 2020

N/A

Educators, students

Ongoing

Scheme for Promotion of Academic and Research Collaboration (SPARC)

2018

Ministry of Education

Promote research collaboration between Indian and foreign institutions

₹418 crore

Researchers

Ongoing

Higher Education Financing Agency (HEFA)

2017

Ministry of Education

Finance infrastructure projects in higher education

₹1 lakh crore

Educational institutions

Ongoing

Pradhan Mantri Matru Vandana Yojna

2017

Ministry of Women & Child Development

Maternity benefit scheme for pregnant and lactating women

₹12,661 crore

Pregnant women

Ongoing

Poshan Abhiyan

2018

Ministry of Women & Child Development

Improve nutritional outcomes for children, pregnant women, and lactating mothers

₹9,046 crore

Women and children

Ongoing

Rashtriya Poshan Maah

2018

Ministry of Women & Child Development

Nutrition awareness campaign

N/A

General public

Annual event

Pradhan Mantri Kaushal Vikas Yojna

2015

Ministry of Skill Development

Skill development and certification

₹12,000 crore

Youth

Ongoing

Unique Land Parcel Identification Number (ULPIN) Scheme

2021

Ministry of Rural Development

Assign unique IDs to land parcels

N/A

Landowners

Ongoing

National Social Assistance Programme (NSAP)

1995

Ministry of Rural Development

Social pensions for elderly, widows, and disabled persons

₹9,200 crore

Vulnerable groups

Ongoing

Mahatma Gandhi National Rural Employment Guarantee Scheme (MGNREGS)

2006

Ministry of Rural Development

Guarantee 100 days of wage employment to rural households

₹1.11 lakh crore

Rural workers

Ongoing

Rashtriya Aajivika Mission

2011

Ministry of Rural Development

Promote self-employment and skilled wage employment

₹5,000 crore

Rural poor

Ongoing

Gram Panchayat Development Plans

2015

Ministry of Panchayati Raj

Bottom-up planning at Gram Panchayat level

N/A

Rural population

Ongoing

Startup Village Entrepreneurship Programme

2016

Ministry of Rural Development

Promote entrepreneurship in rural areas

₹700 crore

Rural entrepreneurs

Ongoing

DDU Grameen Kaushalya Yojna

2014

Ministry of Rural Development

Skill training for rural youth

₹1,500 crore

Rural youth

Ongoing

Global Housing Technology Challenge

2019

Ministry of Housing & Urban Affairs

Promote innovative construction technologies

N/A

Construction sector

Ongoing

Safaimitra Suraksha Challenge

2020

Ministry of Housing & Urban Affairs

Promote mechanized cleaning of sewers

N/A

Sanitation workers

Ongoing

PM SVANIDI

2020

Ministry of Housing & Urban Affairs

Micro-credit scheme for street vendors

₹10,000 crore

Street vendors

Ongoing

Climate-Smart City Assessment Framework

2021

Ministry of Housing & Urban Affairs

Evaluate climate actions in cities

N/A

Urban residents

Ongoing

Swachh Sarvekshan

2016

Ministry of Housing & Urban Affairs

Annual cleanliness survey

N/A

Urban population

Annual event

Rashtriya Swachhta Kendra

2020

Ministry of Housing & Urban Affairs

National center for cleanliness awareness

N/A

General public

Ongoing

Grand ICT Challenge

2020

Ministry of Electronics & IT

Promote innovative ICT solutions

N/A

Tech startups

Ongoing

Ambekar Social Innovation & Incubation Mission

2019

Ministry of Social Justice & Empowerment

Promote social entrepreneurship

N/A

Social entrepreneurs

Ongoing

Saral Jeevan Bima

2021

IRDAI

Standard term life insurance policy

N/A

Insurance buyers

Ongoing

One District One Product Scheme

2018

Ministry of Commerce & Industry

Promote district-specific products

₹6,000 crore

Local entrepreneurs

Ongoing

PRARAMBH: Startup India International Summit

2021

Ministry of Commerce & Industry

Global platform for startups

N/A

Startups

Annual event

Merchandise Export From India Scheme

2015

Ministry of Commerce & Industry

Incentives for goods exporters

₹40,000 crore

Exporters

Ongoing

SAMARTH Scheme

2017

Ministry of Textiles

Skill development in textile sector

₹1,300 crore

Textile workers

Ongoing

National Technical Textile Mission

2020

Ministry of Textiles

Promote technical textiles

₹1,480 crore

Textile industry

2024

Sagarmala Sea Plane Services

2020

Ministry of Ports, Shipping & Waterways

Enhance coastal and inland water connectivity

N/A

Tourists, travelers

Ongoing

Atal Beemit Vyakti Kalyan Yojna

2018

Ministry of Labour & Employment

Provide financial support to unemployed insured persons

₹6,500 crore

Unemployed persons

Ongoing

Nation Career Service Project

2015

Ministry of Labour & Employment

Employment services and career counseling

₹1,000 crore

Job seekers

Ongoing

Vision 2035

2020

NITI Aayog

Long-term policy vision for India

N/A

Policy makers

2035

NPMPF (‘National Program and Project Management Policy Framework’)

2020

NITI Aayog

Improve project management practices

N/A

Government agencies

Ongoing

Aatmanirbhar Bharat ARISE-Atal New India Challenge

2020

Atal Innovation Mission

Support startups with innovative solutions

₹500 crore

Startups

Ongoing

Startup India Seed Fund Scheme (SISFS)

2021

Department for Promotion of Industry & Internal Trade

Financial support to early-stage startups

₹945 crore

Startups

2025

Important Government Schemes FAQs

Q1: How many government schemes should I study for UPSC 2026?

Ans: Focus on 80–100 current and flagship schemes, especially those mentioned in PIB, Budget, and Economic Survey.

Q2: Which government source is best for reading about schemes?

Ans: Use PIB, Yojana magazine, Kurukshetra, and ministry websites. Avoid relying solely on coaching material.

Q3: How to remember so many schemes effectively?

Ans: Use short notes, categorization (GS Paper-wise), and visual tools like flowcharts or tables for memory retention.

Q4: Should I quote schemes in Ethics and Essay papers?

Ans: Yes, referring to schemes in Ethics case studies or Essay themes like social justice enhances answer quality.

Q5: Are schemes relevant for all UPSC stages?

Ans: Absolutely. Schemes play a key role in Prelims (MCQs), Mains (GS, Essay, Ethics), and even in Interview discussions.

Daily Editorial Analysis 1 May 2026

Daily-Editorial-Analysis

On May Day, A Workforce in India Without a Floor

Context

  • May Day, traditionally a celebration of workers’ rights and achievements, arrives in 2026 as a stark reflection of the condition of labour in India.
  • Two significant events in April, the Noida garment workers’ protest and the fatal industrial accident at Singhitarai, offer a powerful lens through which to examine the outcomes of recent labour reforms.
  • Though different in form, both incidents highlight the same underlying issue: a labour system struggling to overhaul both fair wages and safe working conditions.

The Noida Protest: Struggle for a Living Wage

  • Wage Disparities and Economic Pressure
    • In April 2026, thousands of garment workers in Noida’s Phase 2 Hosiery Complex went on strike, demanding a minimum monthly wage of ₹20,000.
    • Their protest was rooted in a clear disparity: workers in neighbouring Haryana had recently received a substantial wage increase, leaving Noida workers earning significantly less for comparable work.
    • Despite the Uttar Pradesh government announcing a 21% interim wage hike, workers rejected the offer.
    • The revised wages still fell short of meeting the basic cost of living in the National Capital Region, where expenses such as rent, fuel, and education continue to rise.
  • State Response and Worker Resistance
    • The protest escalated as authorities deployed police forces to control the situation, leading to detentions and clashes.
    • This response revealed a growing disconnect between policy decisions and workers’ realities.
    • Rather than addressing the core issue of wage adequacy, the state’s actions highlighted the limited space available for labour dissent.

The Singhitarai Tragedy: The Cost of Unsafe Workplaces

  • Industrial Negligence and Loss of Life
    • Just days after the Noida protest, a boiler explosion at a thermal power plant in Chhattisgarh resulted in the deaths of 20 workers.
    • Investigations attributed the incident to poor maintenance and negligence, including excessive fuel buildup that caused a pressure surge.
    • This tragedy underscores the persistent risks faced by industrial workers, particularly in sectors where safety standards are inconsistently enforced.
  • Contract Labour and Accountability Gaps
    • A notable aspect of the incident is that the victims were contract workers employed through a subcontractor.
    • This reflects a broader trend in India’s labour market, where contractual employment reduces direct accountability of principal employers and weakens worker protections.
    • The recurrence of such accidents, coupled with low rates of legal accountability, highlights systemic failures in enforcing workplace safety.

Labour Reforms and Structural Changes

  • Introduction of the Four Labour Codes
    • In November 2025, India implemented four consolidated labour codes, replacing 29 existing laws.
    • These reforms aimed to simplify regulations and modernise the legal framework governing labour.
    • However, the changes have significantly altered worker protections.
    • The threshold for requiring government approval for layoffs has been increased, allowing many firms to retrench workers without oversight.
    • Similarly, revised definitions of factory exclude smaller units from mandatory safety regulations.
  • Impact on Worker Coverage and Safety
    • Since a large proportion of India’s workforce is employed in small-scale industries, these changes effectively remove protections for a significant segment of workers.
    • The shift toward self-certification and digital inspection systems further weakens enforcement, reducing the likelihood of detecting violations.

Restrictions on Collective Action

  • Stricter Rules for Strikes
    • The new labour framework imposes stringent conditions on workers’ right to strike.
    • Mandatory advance notice periods and restrictions during dispute resolution processes make it difficult to organise lawful protests.
    • Additionally, actions such as mass leave-taking are now classified as strikes, further limiting workers’ ability to express dissent.
  • Implications for Labour Rights
    • These procedural barriers reduce the effectiveness of trade unions and weaken collective bargaining power.
    • As a result, workers face greater challenges in negotiating wages and working conditions.

Reform versus Dilution

  • The Need for Modernisation
    • There is a legitimate argument for updating India’s labour laws, many of which were designed for an earlier industrial era.
    • The evolving nature of work, including the rise of gig and platform economies, necessitates a more contemporary legal framework.
  • Concerns Over Reduced Protections
    • However, the manner in which reforms have been implemented raises concerns.
    • Instead of balancing efficiency with protection, the changes appear to prioritise ease of doing business over worker welfare.
    • Simplification has, in many cases, translated into reduced safeguards.

Conclusion

  • The events in Noida and Singhitarai illustrate two dimensions of the same crisis: inadequate wages and unsafe working conditions.
  • Together, they reveal a labour system that has shifted away from its fundamental purpose of protecting workers.
  • A meaningful labour framework must ensure that workers can both earn a dignified living and work in safe environments.
  • Unless reforms are revisited with a stronger focus on worker welfare, May Day will remain less a celebration of progress and more a reminder of unresolved challenges.

On May Day, A Workforce in India Without a Floor FAQs

Q1. What triggered the Noida workers’ protest in April 2026?
Ans. The protest was triggered by wage disparities between Noida workers and those in neighbouring Haryana, along with the demand for a minimum monthly wage of ₹20,000.

Q2. What caused the Singhitarai industrial accident?
Ans. The accident was caused by a boiler explosion resulting from excessive fuel buildup and poor maintenance of equipment.

Q3. How do the new labour codes affect small-scale industries?
Ans. The new labour codes raise thresholds that exclude many small-scale industries from safety regulations and oversight.

Q4. What restrictions have been placed on workers’ right to strike?
Ans. Workers are required to give advance notice and cannot strike during dispute proceedings, making collective action more difficult.

Q5. What is the central issue highlighted by both events?
Ans. Both events highlight the failure of the labour system to ensure fair wages and safe working conditions for workers.

Source: The Hindu


India’s Sprint Beyond the Dairy Red Line to the Pacific

Context

  • The conclusion of the Free Trade Agreement between India and New Zealand in December 2025 marks a pivotal moment in India’s evolving trade strategy.
  • Coming at a time of fragmented global supply chains and increasing protectionism, the agreement reflects India’s transition from a cautious negotiator to an assertive and agile trade partner.
  • Anchored in the vision of Viksit Bharat, this FTA illustrates a broader recalibration of India’s foreign trade policy, one that balances strategic autonomy with deeper global integration.
  • The agreement delivers multiple economic and geopolitical advantages, positioning India as a proactive force in shaping contemporary trade dynamics.

From Gradualism to Speed: A New Trade Paradigm

  • One of the most striking features of this FTA is the speed at which it was negotiated.
  • Initiated in March 2025 and concluded within nine months, it stands among India’s fastest trade agreements.
  • Historically known for its prolonged and cautious negotiation style, India’s ability to compress timelines signals institutional maturity and enhanced coordination.
  • This rapid execution not only grants India a first-mover advantage in the Oceania region but also sends a strong signal to global partners about its readiness to engage efficiently.
  • The shift away from the traditional slow burn approach highlights India’s ambition to become a central player in global trade networks.

Human Capital as a Core Economic Driver

  • Unlike conventional trade agreements that prioritise goods and tariffs, this FTA foregrounds human capital mobility as a key pillar.
  • The inclusion of professional visas, youth exchange programs, and mutual recognition of traditional knowledge systems represents a progressive step in trade diplomacy.
  • The provision of 5,000 annual professional visas for Indian workers in sectors like IT, engineering, and healthcare facilitates the global integration of India’s skilled workforce.
  • Additionally, the work-and-holiday visa scheme promotes youth engagement and cultural exchange.
  • A particularly innovative feature is the mutual recognition of traditional health systems, including AYUSH practices from India and Māori health traditions from New Zealand.
  • This not only expands the scope of trade beyond material goods but also elevates cultural and intellectual exchanges to the level of economic cooperation.

Capital Inflows and Industrial Growth

  • The agreement also promises substantial capital inflows, approximately $20 billion over 15 years, into key sectors such as renewable energy, agri-tech, education, and healthcare.
  • These investments are expected to act as catalysts for domestic growth, complementing initiatives like the Make in India programme.
  • By leveraging New Zealand’s technological expertise and financial resources, India aims to strengthen its manufacturing base and accelerate sectoral modernisation.

Strategic Protection of Sensitive Sectors

  • Despite its openness, the FTA demonstrates a careful balancing act by protecting sensitive domestic industries, particularly dairy.
  • India has successfully excluded key dairy products such as milk, cheese, and yogurt from tariff concessions, safeguarding the livelihoods of millions of farmers.
  • At the same time, it allows calibrated access to specialised dairy inputs like infant formula, ensuring that domestic industries can benefit from high-quality imports without facing overwhelming competition.
  • The introduction of mechanisms such as tariff rate quotas, minimum import prices, and seasonal restrictions reflects a nuanced approach to trade liberalization.
  • Furthermore, the Ring-Fenced Value Addition Framework encourages domestic manufacturing by allowing duty-free imports for export-oriented production, thereby boosting downstream industries.

Strengthening Intellectual Property Rights

  • Another significant achievement is New Zealand’s commitment to strengthen legal protection for Indian Geographical Indication (GI) products.
  • Within 18 months, legislative changes are expected to provide safeguards comparable to those in the European Union.
  • This will enhance the global recognition and market value of iconic Indian products like Darjeeling tea and Basmati rice, protecting them from imitation and unfair competition.

Expanding India’s Geopolitical Footprint

  • Beyond economics, the FTA carries substantial geopolitical implications. By deepening ties with New Zealand, India secures a strategic foothold in the South Pacific region.
  • New Zealand’s position as a gateway to Pacific Island countries enhances India’s access to emerging markets and strengthens its regional influence.
  • Additionally, alignment with New Zealand’s regulatory frameworks allows India to benchmark itself against standards set by organisations like the Organisation for Economic Co-operation and Development.
  • This agreement thus serves as both a trade instrument and a geopolitical hedge, enabling India to diversify its partnerships while reinforcing its role in global supply chains.

Conclusion

  • The India–New Zealand FTA exemplifies a transformative shift in India’s trade policy, from cautious incrementalism to strategic dynamism.
  • By integrating rapid execution, talent mobility, capital inflows, sectoral protection, and geopolitical foresight, the agreement reflects a comprehensive approach to economic diplomacy.
  • It not only strengthens bilateral ties but also positions India as a confident and capable participant in the evolving global economic order.
  • As India advances toward its Viksit Bharat vision, such agreements will likely play a crucial role in shaping its trajectory as a global economic power.

India’s Sprint Beyond the Dairy Red Line to the Pacific FAQs

Q1. When was the FTA between India and New Zealand concluded?
Ans. The FTA between India and New Zealand was concluded in December 2025.

Q2. What major shift does this FTA represent in India’s trade policy?
Ans. This FTA represents India’s shift from a cautious approach to a faster and more strategic trade policy.

Q3. How does the agreement support human capital mobility?
Ans. The agreement supports human capital mobility by providing professional visas and promoting youth and cultural exchanges.

Q4. Which sensitive sector has India protected in the FTA?
Ans. India has protected its dairy sector by excluding key products from tariff concessions.

Q5. Why is this FTA geopolitically important for India?
Ans. This FTA is geopolitically important because it helps India expand its presence in the South Pacific region.

Source: The Hindu

Daily Editorial Analysis 1 May 2026 FAQs

Q1: What is editorial analysis?

Ans: Editorial analysis is the critical examination and interpretation of newspaper editorials to extract key insights, arguments, and perspectives relevant to UPSC preparation.

Q2: What is an editorial analyst?

Ans: An editorial analyst is someone who studies and breaks down editorials to highlight their relevance, structure, and usefulness for competitive exams like the UPSC.

Q3: What is an editorial for UPSC?

Ans: For UPSC, an editorial refers to opinion-based articles in reputed newspapers that provide analysis on current affairs, governance, policy, and socio-economic issues.

Q4: What are the sources of UPSC Editorial Analysis?

Ans: Key sources include editorials from The Hindu and Indian Express.

Q5: Can Editorial Analysis help in Mains Answer Writing?

Ans: Yes, editorial analysis enhances content quality, analytical depth, and structure in Mains answer writing.

Top 10 Intercontinental Ballistic Missiles, List, Range, Speed

Top 10 Intercontinental Ballistic Missiles

The Top 10 Intercontinental Ballistic Missiles represent the most advanced nuclear deterrence systems globally, combining extreme range, payload capacity, accuracy, survivability, and penetration capabilities. These missiles form the backbone of nuclear triads maintained by major powers such as Russia, the United States, China, France, and India. Technological advancements like MIRVs, hypersonic glide vehicles, canisterised launches, and satellite-aided navigation have significantly enhanced their effectiveness. Deployed on land, sea, and mobile platforms, these missiles ensure credible deterrence and strategic stability in an era of evolving missile defence systems.

Intercontinental Ballistic Missiles (ICBMs)

Intercontinental Ballistic Missiles (ICBMs) are the most powerful long-range nuclear delivery systems in modern warfare. These missiles can strike targets beyond 5,500 kilometres, travelling through space before re-entering Earth’s atmosphere at hypersonic speeds exceeding Mach 20. ICBMs can be launched from underground silos, mobile road launchers, or submarines, ensuring survivability and second-strike capability. Equipped with Multiple Independently Targetable Re-entry Vehicles (MIRVs), a single missile can hit multiple targets simultaneously. As of 2025, Russia possesses the world’s largest ICBM force, with around 306 strategic missiles capable of carrying nearly 1,185 nuclear warheads.

Top 10 Intercontinental Ballistic Missiles List

The list of Top 10 Intercontinental Ballistic Missiles has been given below: 

  1. RS-28 Sarmat (Russia)
  2. DF-41 (China)
  3. LGM-35 Sentinel (United States)
  4. Trident II D5 (United States / United Kingdom)
  5. RS-24 Yars (Russia)
  6. M51 (France)
  7. R-29RMU2.1 Layner (Russia)
  8. LGM-30G Minuteman III (United States)
  9. JL-2 (China)
  10. Agni-V (India)

1. RS-28 Sarmat (Russia)

RS-28 Sarmat, also called Satan II, is Russia’s heaviest and longest-range ICBM, designed to defeat all existing missile defence systems globally. Features:

  • Launch weight: ~208 tonnes; length: 35.3 metres
  • Maximum range: up to 18,000 kilometres
  • Liquid-fuelled, silo-based missile
  • Carries 10-15 MIRVs or 3 Avangard hypersonic glide vehicles
  • Individual warhead yield: up to 750 kilotons
  • Uses Fractional Orbital Bombardment System (FOBS)
  • Can approach targets via South Pole trajectory
  • Central pillar of Russia’s strategic deterrence

2. DF-41 (China)

DF-41 is China’s most advanced road-mobile ICBM, enhancing survivability and long-range nuclear strike capability. Features:

  • Range: 12,000-15,000 kilometres
  • Solid-fuel, three-stage missile
  • Speed: approximately Mach 25
  • Capable of carrying up to 10 MIRVs
  • Uses BeiDou satellite-aided guidance
  • Accuracy: ~100 metres CEP
  • Operated by PLA Rocket Force
  • Entered service around 2017

3. LGM-35 Sentinel (United States)

LGM-35 Sentinel is a next-generation silo-based ICBM replacing Minuteman III for long-term land deterrence.

  • Range: approximately 13,000 kilometres
  • Three-stage, solid-fuel missile
  • Warheads: W87 Mod 0 or Mod 1 (300-475 kt)
  • Managed by Northrop Grumman
  • Program cost: about USD 140.9 billion
  • Deployment planned around 2030
  • Designed to remain operational until 2075

4. Trident II D5 (United States)

Trident II D5 is a highly accurate submarine-launched missile forming the sea-based nuclear deterrent of NATO powers. It was developed by the United States, although used by both the United States as well as the United Kingdom. Features:

  • Range: about 12,000 kilometres
  • Speed: Mach 24
  • Carries up to 8 MIRVs
  • Accuracy: ~90 metres CEP
  • Deployed on Ohio-class and Vanguard submarines
  • Over 190 successful test launches
  • Operational since the 1990s

5. RS-24 Yars (Russia)

RS-24 Yars is a modern Russian solid-fuel ICBM designed for both silo and mobile deployment. Features:

  • Range: ~10,500 kilometres
  • Launch weight: ~49,000 kg
  • Carries up to 10 MIRVs
  • Warhead yield: 150-300 kilotons
  • Uses inertial plus GLONASS guidance
  • Accuracy: ~250 metres CEP
  • Equipped with advanced decoys and penetration aids

Also Read: Missiles of India

6. M51 (France)

M51 is France’s primary submarine-launched ballistic missile ensuring independent nuclear deterrence capability at sea.

  • Range: ~8,000 kilometres
  • Three-stage solid-fuel missile
  • Launch weight: ~53,000 kg
  • Carries 4-6 MIRVs
  • Warheads: TN-75 or TNO (up to 150 kt)
  • Deployed on Triomphant-class submarines
  • Operational since 2010

7. R-29RMU2.1 Layner (Russia)

R-29RMU2.1 Layner strengthens Russia’s naval nuclear forces with flexible warhead configurations and extended strike range.

  • Range: up to 12,000 kilometres
  • Submarine-launched from Delta IV class
  • Carries up to 12 low-yield MIRVs
  • Designed to overwhelm missile defences
  • Uses advanced countermeasures and decoys
  • Ensures credible second-strike capability

8. LGM-30G Minuteman III (United States)

Minuteman III remains the backbone of America’s land-based nuclear deterrent despite gradual replacement plans. Features:

  • Range: ~13,000 kilometres
  • In service since 1970
  • Three-stage solid-fuel missile
  • Current load: single W78 or W87 warhead
  • Yield: 300-475 kilotons
  • Accuracy: ~120 metres CEP
  • Deployed in hardened underground silos

9. JL-2 (China)

JL-2 provides China with its first credible sea-based nuclear deterrence capability through submarine deployment.Features:

  • Range: ~7,000-8,000 kilometres
  • Deployed on Type-094 Jin-class submarines
  • Solid-fuel propulsion
  • Carries 3-4 MIRVs
  • Warhead yield: ~90 kilotons each
  • Uses inertial and satellite-assisted guidance

10. Agni-V (India)

Agni-V is India’s longest-range missile, enabling credible minimum deterrence and strengthening strategic reach beyond Asia. Features:

  • Range: 7,000-8,000 kilometres
  • Three-stage solid-fuel missile
  • Road-mobile and canisterised launch system
  • Speed: up to Mach 24
  • Carries 3-6 MIRVs (future capability- 10-12)
  • Accuracy: less than 10 metres CEP
  • Uses inertial navigation with NavIC/ GPS support
  • Core component of India’s nuclear triad

Top 10 Intercontinental Ballistic Missiles FAQs

Q1: What are the Top 10 Intercontinental Ballistic Missiles?

Ans: The Top 10 Intercontinental Ballistic Missiles include RS-28 Sarmat, DF-41, LGM-35 Sentinel, Trident II D5, RS-24 Yars, M51, Layner, Minuteman III, JL-2, and Agni-V.

Q2: Which country has the most missiles in the Top 10 Intercontinental Ballistic Missiles list?

Ans: Russia leads the Top 10 Intercontinental Ballistic Missiles list with Sarmat, Yars, and Layner systems forming its strategic core.

Q3: Which is the most powerful among the Top 10 Intercontinental Ballistic Missiles?

Ans: RS-28 Sarmat (Russia) is the most powerful among the Top 10 Intercontinental Ballistic Missiles, with up to 18,000 km range and heavy MIRV payload.

Q4: Why are MIRVs important in the Top 10 Intercontinental Ballistic Missiles?

Ans: MIRVs allow Top 10 Intercontinental Ballistic Missiles to strike multiple targets simultaneously, overwhelming missile defence systems effectively.

Q5: Which missile represents India in the Top 10 Intercontinental Ballistic Missiles?

Ans: Agni-V represents India in the Top 10 Intercontinental Ballistic Missiles, with a 7,000-8,000 km range and canisterised road-mobile launch.

World Organisations and Their Headquarters, List, Established Date

World Organisations and Their Headquarters

A World Organisation is a grouping composed of member states from multiple countries. These organisations serve as catalysts for collaboration, incorporating cooperation among their member nations. Their primary role is to promote the welfare and development of these nations, often by offering financial support to countries in need. 

List of World Organisations and Their Headquarters is an important General Knowledge topic. The question from this topic can be asked in the General Awareness section. Candidates preparing for UPSC must learn the list given in this article. 

World Organisations and Their Headquarters

In today’s world, creating unity in the world to maintain peace, the International Organisation came into existence and has functioned since then. One of the key objectives of such organisations is to ensure peace among the member countries while contributing to their economic and social progress. These organisations tackle the conflicts where more than one country is being affected and the diversity is being hampered. 

List of World Organisations and Their Headquarters

In recent days where there are conflicts going on in various nations,these organisations are the incharge to maintaining the peace and improving the quality of lives of the citizens of that country. Below in the table we have shared the List of World Organisations and Their Headquarters to know which organisations work for which concern and are there any similar common goals to address.

List of World Organisations and Their Headquarters

Organisation 

Headquarters

Established

United Nations Development Programme (UNDP)

New York City, USA

1965

United Nations Environment Programme (UNEP)

Nairobi, Kenya

1972

United Nations Population Fund (UNPF)

New York City, USA

1969

United Nations Human Settlement Programme (UN-Habitat)

Nairobi, Kenya

1978

United Nations Children's Fund (UNICEF)

New York City, USA

1946

World Food Programme (WFP)

Rome, Italy

1961

Food and Agriculture Organization (FAO)

Rome, Italy

1945

International Civil Aviation Organization (ICAO)

Montreal, Canada

1947

International Fund for Agricultural Development (IFAD)

Rome, Italy

1977

International Labour Organization (ILO)

Geneva, Switzerland

1919

International Monetary Fund (IMF)

Washington, DC, USA

1944

International Maritime Organization (IMO)

London, United Kingdom

1948

International Telecommunication Union (ITU)

Geneva, Switzerland

1865

United Nations Educational, Scientific and Cultural Organization (UNESCO)

Paris, France

1945

United Nations Industrial Development Organization (UNIDO)

Vienna, Austria

1966

World Tourism Organization (UNWTO)

Madrid, Spain

1974

Universal Postal Union (UPU)

Bern, Switzerland

1874

World Health Organization (WHO)

Geneva, Switzerland

1948

World Intellectual Property Organization (WIPO)

Geneva, Switzerland

1967

World Meteorological Organization (WMO)

Geneva, Switzerland

1950

World Bank

Washington, DC, USA

1944

Joint United Nations Programme on HIV/AIDS (UNAIDS)

Geneva, Switzerland

1994

United Nations High Commissioner for Refugees (UNHCR)

Geneva, Switzerland

1950

United Nations Institute for Disarmament Research (UNIDIR)

Geneva, Switzerland

1980

United Nations Institute for Training and Research (UNITAR)

Geneva, Switzerland

1963

United Nations Office for Project Services (UNOPS)

Copenhagen, Denmark

1973

United Nations Relief and Works Agency for Palestine Refugees (UNRWA)

Amman, Jordan

1949

United Nations System Staff College (UNSSC)

Turin, Italy

2002

United Nations University (UNU)

Tokyo, Japan

1973

UN Women

New York City, USA

2010

International Atomic Energy Agency (IAEA)

Vienna, Austria

1957

International Organization for Migration (IOM)

Geneva, Switzerland

1951

Organization for the Prohibition of Chemical Weapons (OPCW)

The Hague, Netherlands

1997

United Nations Framework Convention on Climate Change (UNFCCC)

Bonn, Germany

1994 (Signed in 1993)

World Trade Organization (WTO)

Geneva, Switzerland

1995

International Trade Centre (ITC)

Geneva, Switzerland

1964

African Development Bank Group

Abidjan, Cote d'Ivoire

1964

African Union (AU)

Addis Abab, Ethiopia

2002

Amnesty International (AI)

London, United Kingdom

1961

Andean Community 

Lima, Peru

1969

Arctic Council

Tromso, Norway

1996

Asia-Pacific Economic Cooperation (APEC)

Queenstown, Singapore

1989

Asian Development Bank (ADB)

Mandaluyong, Philippines

1966

Association of Caribbean States (ACS)

Port of Spain, Trinidad, Tobago

1994

Association of Southeast Asian Nations (ASEAN)

Jakarta, Indonesia

1967

Bank for International Settlements (BIS)

Basel, Switzerland

1930

Black Sea Economic Cooperation (BSEC)

Istanbul, Turkey

1992

Caribbean Community (CARICOM)

Georgetown, Guyana

1973

Central American Bank for Economic Integration 

Tegucigalpa, Honduras

1960

Common Market for Eastern and Southern Africa (COMESA)

Lusaka, Zambia

1994

Commonwealth Secretariat

London, United Kingdom

1965

Council of Europe

Strasbourg, France

1949

Council of European Municipalities and Regions (CEMR)

Geneva, Switzerland

1951

Council of the Baltic Sea States (CBSS)

Stockholm, Switzerland

1992

Economic Community of West African States (ECOWAS)

Federal Capital Territory, Nigeria

1975

European Bank for Reconstruction and Development (EBRD)

London, United Kingdom

1991

European Central Bank (ECB)

Frankfurt, Germany

1998

European Free Trade Association (EFTA)

Geneva, Switzerland

1960

Association of European Parliamentarians with Africa (AWEPA)

Amsterdam, Netherlands

1984

European Space Agency (ESA)

Paris, France

1975

European Union (EU)

Brussels, Belgium

1993

Group of Eight (G8)

New York, USA

1975

G-15 Summit

Geneva, Switzerland

1990

Inter-American Development Bank (IDB)

Washington, DC, USA

1959

Intergovernmental Authority on Development (IGAD)

Djibouti, Djibouti

1986

International Atomic Energy Agency (IAEA)

Vienna, Austria

1957

International Civil Aviation Organization (ICAO)

Montreal, Canada

1947

International Chamber of Commerce (ICC)

Paris, France

1919

International Committee of the Red Cross (ICRC)

Geneva, Switzerland

1863

International Court of Justice (ICJ)

The Hague, Netherlands

1945

International Development Association (IDA)

Washington, DC, USA

1960

International Federation of Red Cross and Red Crescent Societies (IFRC)

Geneva, Switzerland

1919

International Finance Corporation (IFC)

Washington, DC, USA

1956

International Labour Organization (ILO)

Geneva, Switzerland

1919

International Olympic Committee (IOC)

Lausanne, Switzerland

1894

International Organization for Standardization (ISO)

Geneva, Switzerland

1947

International Peace Bureau (IPB)

Geneva, Switzerland

1891

International Seabed Authority (ISA)

Kingston, Jamaica

1994

International Service for Human Rights (ISHR)

Geneva, Switzerland

1984

Inter-Parliamentary Union

Geneva, Switzerland

1889

League of Arab States

Cairo, Egypt

1945

Multilateral Investment Guarantee Agency (MIGA)

Washington, DC, USA

1988

The Non-Aligned Movement (NAM)

Central Jakarta, Indonesia

1961

Nordic Council of Ministers

Copenhagen, Denmark

1971

North Atlantic Treaty Organization (NATO)

Washington, DC, USA

1949

Organisation for Economic Co-operation and Development (OECD)

Paris, France

1961

Organisation for Security and Co-operation in Europe (OSCE)

Vienna, Austria

1975

Organization of Arab Petroleum Exporting Countries (OAPEC)

Kuwait, Middle East

1968

Organization of the Islamic Conference (OIC)

Jeddah, Saudi Arabia

1969

Organization of the Petroleum Exporting Countries (OPEC)

Vienna, Austria

1960

Secretariat of the Pacific Community (SPC)

Noumea, New Caledonia

1947

South Asian Association for Regional Cooperation (SAARC)

Kathmandu, Nepal

1985

Unión Latina

Paris, France

1954

United Cities & Local Governments (UCLG)

Barcelona, Spain

2004

United Nations Economic and Social Commission for Asia and the Pacific (ESCAP)

Bangkok, Thailand

1947

United Nations Economic and Social Commission for Western Asia (ESCWA)

Beirut, Lebanon

1973

United Nations Environmental Program (UNEP)

Nairobi, Kenya

1972

United Nations Food and Agriculture Organization (FAO)

Rome, Italy

1945

United Nations High Commissioner for Human Rights (UNHCHR)

Geneva, Switzerland and New York City, USA

1993

United Nations Office on Drugs and Crime (UNODC)

Vienna, Austria

1997

United Nations International Research and Training Institute for the Advancement of Women (INSTRAW)

Santo Domingo, Dominican Republic

1975

United Nations Office for the Coordination of Humanitarian Affairs (OCHA)

Geneva, Switzerland and New York City, USA

1991

United Nations Relief and Works Agency for Palestine Refugees in the Near East (UNRWA)

Amman, Jordan

1949

Western European Union (WEU)

Paris, France

1954

World Federation of United Nations Associations (WFUNA)

Geneva, Switzerland and New York City, USA

1946

World Organization Against Torture (OMCT)

Geneva, Switzerland

1985

World Wide Fund for Nature (WWF)

Gland, Switzerland

1961

List of International Organizations where India is Member

India's membership in various international organisations plays an important role in its development and global standing. Although the United States has re-classified India from a developing nation to a developed one. These international organisations offer crucial aid, making it essential to acknowledge the key global bodies to which India belongs.

List of International Organizations where India is Member

International Organization

Headquarters

Year of Foundation

AALCO - Asian-African Legal Consultative Organization

New Delhi

1956

ADB - Asian Development Bank

Manila, Philippines 

1956

AfDB - African Development Bank (non-regional members)

Tunis, Tunisia

1964

AG - Australia Group

Brussels, Belgium

1985

ASEAN Regional Forum - The Association of Southeast Asian Nations

Jakarta, Indonesia

1967

BIMSTEC - Bay of Bengal Initiative for Multi-Sectoral Technical and Economic Cooperation

Dhaka, Bangladesh

1997

BIS - Bank for International Settlements

Basel, Switzerland

1930

BRICS - Brazil, Russia, India, China, and South Africa

Shanghai, China

2006

CoN - Commonwealth of Nations

London, UK

1931

CERN - European Organization for Nuclear Research 

Geneva, Switzerland

1954

CP - Colombo Plan

Colombo, Srilanka

1950

EAS - East Asia Summit

Colombo, Sri Lanka

1950

FAO - Food and Agriculture Organization of the United Nations

Rome, Itlay

1945

G-15 - Group of 15

Geneva, Switzerland

1989

G-20 - Group of 20

Cancun, Mexico

1999

G-77 - Group of 77

New York

1964

IAEA - International Atomic Energy Agency

Vienna, Austria

1957

IBRD - International Bank for Reconstruction and Development (World Bank)

Washington DC, US

1944

ICAO - International Civil Aviation Organization

Montreal, Canada

1944

ICC - International Chamber of Commerce

Paris, France

1919

IDA - International Development Association

Washington DC

1950

IEA - International Energy Agency

Paris, France

1974

IFAD - International Fund for Agricultural Development

Rome, Italy

1977

IFC - International Finance Corporation

Washington DC, US

1956

ILO - International Labour Organization

Geneva, Switzerland

1919

IMF - International Monetary Fund

Washington DC, US

1945

IMO - International Maritime Organization

London, UK

1948

IMSO - International Mobile Satellite Organization

London, UK

1999

Interpol - International Criminal Police Organization

Lyon, France

1923

IOC - International Olympic Committee

Lausanne, Switzerland

1894

IPEEC - International Partnership for Energy Efficiency Cooperation

Paris, France

2009

ISO - International Organization for Standardization

Geneva, Switzerland

1947

ITSO - International Telecommunications Satellite Organization

Washington DC

1964

ITU - International Telecommunication Union

Geneva, Switzerland

1864

ITUC - International Trade Union Confederation (the successor to ICFTU (International Confederation of Free Trade Unions) and the WCL (World Confederation of Labour))

Brussels, Belgium

2006

MTCR Missile Technology Control Regime

Japan

1987

NAM - Non-Aligned Movement

Jakarta, Indonesia

1961

OPCW - Organisation for the Prohibition of Chemical Weapons

Hague, Netherland

1997

PCA - Permanent Court of Arbitration

Hague, Netherland

1899

PIF - Pacific Islands Forum (partner)

Suva, Fiji

1971

SAARC - South Asian Association for Regional Cooperation

Kathmandu, Nepal

1985

SACEP  - South Asia Co-operative Environment Programme

Colombo, Sri Lanka

1982

SCO - Shanghai Cooperation Organisation (member)

Beijing, China

1996

UN - United Nations

New York

1945

UNAIDS  - United Nations Programme on HIV/AIDS

New York

1994

UNESCO - United Nations Educational, Scientific and Cultural Organisation

London, Uk

1946

WHO- World Health Organization

Geneva, Switzerland

1948

International Organization and Their Headquarters Types

  • Intergovernmental Organizations (IGOs):

IGOs are formed through agreements between sovereign nations to address common global or regional concerns. They play a vital role in fostering international cooperation on matters such as health, development, trade, and security. Notable examples include the United Nations (UN), World Health Organization (WHO), International Monetary Fund (IMF), World Bank, and World Trade Organization (WTO).

  • Non-Governmental Organizations (NGOs):

NGOs are independent, non-state entities that operate across borders to advocate for social, humanitarian, and environmental causes. Though not affiliated with governments, their influence in shaping policy and delivering aid is significant. Prominent examples include Amnesty International, Greenpeace, and Médecins Sans Frontières (Doctors Without Borders).

  • Regional Organizations:

These organizations focus on strengthening political, economic, and cultural ties within a specific geographic area. They are designed to address regional challenges through dialogue and cooperation among member states. Examples include the European Union (EU), African Union (AU), and the Association of Southeast Asian Nations (ASEAN).

International Organization and Their Headquarters Characteristics

  1. International Organizations are established through multilateral agreements among sovereign states, allowing member countries to collaborate on shared interests and global challenges. Participation is voluntary, and cooperation is based on mutually agreed principles.
  2. While International Organizations promote collective decision-making, member states maintain their sovereign authority. Most decisions are made through consensus or voting systems to ensure fair representation and respect for each nation’s autonomy.
  3. Each organization operates under clearly defined objectives and mandates, as outlined in its founding charter. These goals shape the organization’s strategies, programs, and areas of engagement.
  4. Most international Organizations have permanent headquarters in key global cities. Their governance structures typically include bodies such as a General Assembly, Executive Council, Secretariat, and specialized agencies tailored to their operational needs.
  5. International Organizations are funded through contributions from member states, as well as grants and voluntary donations. The financial contribution from each country is usually determined by its economic capacity or agreed-upon criteria.

International Organizations and Their Headquarters Roles

  1. International Organizations such as the United Nations play a vital role in promoting peace and stability across the globe. Through peacekeeping missions, diplomatic interventions, and mediation efforts, they help manage and resolve political and armed conflicts.
  2. In times of natural disasters, armed conflicts, or humanitarian crises, international bodies provide essential relief, including food, shelter, medical care, and logistical support, to affected populations.
  3. Institutions like the World Bank and the International Monetary Fund (IMF) assist developing nations by offering financial aid, policy advice, and infrastructure development programs aimed at promoting sustainable economic growth.
  4. Organizations such as the World Health Organization (WHO) and the United Nations Environment Programme (UNEP) address cross-border health challenges and environmental concerns, promoting global public health standards and environmental sustainability.
  5. The World Trade Organization (WTO) and similar institutions work to streamline international trade, reduce barriers, and ensure fair and equitable trade practices among member countries.

Tricks to remember World Organisations and Their Headquarters

Memorising the names of World Organisations and Their Headquarters can be challenging, but we’ve got you covered. Below, you'll find some simple tricks to help you recall them effortlessly.

Tricks to remember World Organisations and Their Headquarters

Headquarters

Organisations

The organisation which Starts with World and ends with Organization has its headquarters in Geneva

World Health Organisation

World Meteorological Organization

World Intellectual Property Organization

Organisations having money associated with them usually have Headquarters in Washington DC

International Monetary Fund (IMF)

World Bank

Organisations connected to Industrial development, Petroleum, and atomic research have their headquarters in Vienna

United Nations Industrial Development Organization (UNIDO)

International Atomic Energy Agency

Organization of Petroleum Exporting Countries (OPEC)

Organisations which are related to the Economy or Education usually have headquarters in Paris

International Council on Monuments and Sites (ICOMOS)

United Nations Educational Scientific and Cultural Organisation (UNESCO)

Organisation for Economic Cooperation and Development (OECD)

World Organisations and Their Headquarters FAQs

Q1: How many international organisations and their headquarters are there?

Ans: There are 107 international organisations.

Q2: How many organisations are there in the world?

Ans: There are more than 300 intergovernmental organisations around the world.

Q3: What is the world's largest organisation?

Ans: The United Nations is the largest organisation having 193 member states and 2 observer states.

Q4: What is the world No 1 organisation?

Ans: The United Nations (UN) is considered as the world’s no. 1 organisation.

Q5: What are the 8 agencies of the UN and their headquarters?

Ans: FAO. Headquarters: Rome, Italy ICAO. Headquarters: Montreal, Canada IFAD. Headquarters: Rome, Italy ILO. Headquarters: Geneva, Switzerland IMF. Headquarters: Washington, DC, USA IMO. Headquarters: London, United Kingdom ITU. Headquarters: Geneva, Switzerland UNESCO. Headquarters: Paris, France

New Labour Codes 2025, Download PDF, Changes, Benefits, Impact

New Labour Codes

The New Labour Codes 2025 represent a historic transformation in India’s labour governance framework, consolidating 29 outdated and fragmented labour laws into four new labour codes: the Code on Wages, 2019, the Industrial Relations Code, 2020, the Code on Social Security, 2020 and the Occupational Safety, Health and Working Conditions Code, 2020 which are modern, progressive and worker-centric Codes. These reforms significantly improve wage protection, workplace safety, social security access, and ease of compliance for industries. With their implementation starting 21 November 2025, India’s labour ecosystem now reflects global standards and supports the vision of a future-ready workforce and a resilient, competitive economy.

Together, the Codes lay the foundation for Aatmanirbhar Bharat, ensuring that workers, especially women, youth, gig, migrant, and unorganised workers, receive stronger rights and welfare protection.

What Are the Four New Labour Codes?

The Four New Labour Codes, notified by the Government, streamline decades-old laws into a simpler, efficient structure designed for modern economies.

Four New Labour Codes
Labour Code Key Focus Area Major Benefit

Code on Wages, 2019

Wages, minimum wages, payment of wages

Ensures statutory minimum wages for all workers

Industrial Relations Code, 2020

Hiring, firing, dispute resolution, unions

Faster dispute resolution, flexibility in employment

Code on Social Security, 2020

PF, ESIC, maternity, gig workers, unorganised workers

Universal social security coverage

Occupational Safety, Health, and Working Conditions Code, 2020

Occupational safety, health, working conditions

Safer workplaces across all industries

New Labour Codes PDF

The New Labour Codes consolidate 29 existing labour laws into 4 comprehensive codes to simplify and modernise India’s labour regulations. These codes aim to improve the ease of doing business, ensure better social security, and strengthen workers’ rights in a unified framework. The link to download the New Labour Codes has been shared below.

New Labour Codes PDF Download

Why India Needed the New Labour Codes

For decades, India operated under labour laws designed during the 1930s-1950s, a period when the nature of employment, technology and work structures were drastically different. Many provisions became outdated and ineffective for today’s gig economy, digital workforce, MSMEs, and large-scale industries. The Codes solve this by modernising regulations, improving legal clarity, and providing equitable protection across all forms of employment.

Reasons for Reform

  • The old laws were fragmented across 29 Acts with inconsistent definitions and processes.
  • New forms of work, gig, platform, and contractual work need legal recognition.
  • Labour dispute resolution was slow and unpredictable.
  • Social security coverage was extremely limited, excluding gig and informal workers.
  • Women’s participation in night shifts and high-paying sectors was restricted by outdated norms.

[youtube url="https://www.youtube.com/watch?v=nMpr5BYtBbo" width="560" height="315"]

Changes Under New Labour Codes

The transition highlights how the New Labour Codes bring India closer to global labour practices. Workers benefit through formalisation, financial stability and access to social protection, while businesses enjoy simplified compliance and operational flexibility. The Codes strike a balance between worker welfare and industry growth, ensuring that reforms support both productivity and protection.

Changes Under New Labour Codes
Area Pre-Labour Codes Post-Labour Codes (2025)

Formalisation

No mandatory appointment letter

Mandatory appointment letters for all

Social Security

Limited coverage

Universal PF, ESIC, insurance for all workers

Minimum Wages

Only for scheduled employments

Statutory minimum wage for every worker

Healthcare

No annual check-up requirement

Free annual health check-up for workers 40+

Timely Wages

No strict enforcement

Mandatory timely wage payment

Women’s Employment

Restrictions in night shifts

Women allowed in all jobs with safety measures

ESIC Coverage

Only notified areas

PAN-India ESIC coverage, including small units

Compliance

Multiple returns and licences

Single registration, single licence, single return

New Labour Codes Benefits

  1. Fixed-Term Employees (FTE): FTEs get equal pay, benefits and gratuity after one year, reducing excessive contractual hiring.
  2. Gig & Platform Workers: Gig workers receive legal recognition, aggregator-funded welfare, and fully portable Aadhaar-linked benefits.
  3. Contract Workers: Contract workers get equal benefits as permanent staff with gratuity after one year and free annual health check-ups.
  4. Women Workers: Women get equal pay, legal protection, night-shift options with safety and mandatory committee representation.
  5. Youth Workers: Youth receive guaranteed minimum wages, formal appointment letters and mandatory paid leave protection.
  6. MSME Workers: MSME employees gain social security coverage, standard working hours and assured timely wage payment.
  7. Beedi & Cigar Workers: Workers get minimum wages, capped working hours and double overtime rates with bonus eligibility.
  8. Plantation Workers: Plantation workers receive safety training, protective gear and full ESI coverage for families.
  9. Audio-Visual & Digital Media Workers: AV and digital media workers get appointment letters, timely wages and double overtime pay.
  10. Mine Workers: Mine workers receive accident-related coverage, free health check-ups and regulated 8–12 hour work shifts.
  11. Hazardous Industry Workers: Hazardous industry workers get annual health check-ups, national safety standards and gender-inclusive job access.
  12. Textile Workers: Textile workers get equal wages, migrant benefits, longer claim periods and double overtime rates.
  13. IT & ITES Workers: IT workers are assured salary by the 7th, anti-harassment protections and mandatory social

security coverage.

  1. Dock Workers: Dock workers receive legal recognition, PF/pension/insurance benefits and employer-funded health check-ups.
  2. Export Sector Workers: Export workers get gratuity, timely wages, annual leave after 180 days and safe, consent-based night-shift options.

Impact of New Labour Codes on India’s Labour Landscape

India has rapidly expanded social security coverage from 19% in 2015 to 64% in 2025, and the New Labour Codes accelerate this trajectory by making benefits portable, inclusive and technology-driven. They empower workers while easing compliance for industries, creating a balanced and future-ready labour ecosystem that aligns with global standards.

  • Formalisation of the workforce
  • Expanded ESIC and PF coverage
  • Increased women’s participation
  • Better safety and health standards
  • Boost to employment and industry growth

New Labour Codes FAQs

Q1: What are the four new Labour Codes?

Ans: They are the Code on Wages, Industrial Relations Code, Social Security Code, and Occupational Safety, Health & Working Conditions (OSH) Code.

Q2: What is the main objective of Labour Codes?

Ans: To simplify 29 labour laws into 4 codes for ease of compliance, transparency, and worker welfare.

Q3: Are the Labour Codes implemented in India?

Ans: They are notified but not yet fully implemented as states must frame corresponding rules.

Q4: How will the new Labour Codes affect salaries?

Ans: They may reduce take-home pay but increase social security contributions due to a 50% cap on allowances.

Q5: What is the ‘floor wage’ under the Wage Code?

Ans: It is a nationally fixed minimum wage benchmark set by the Centre for all states.

Multidimensional Poverty Index (MPI), Report 2025, Indicator, Calculation

Multidimensional Poverty Index

The Multidimensional Poverty Index (MPI) goes beyond traditional income-based measures to evaluate poverty through various deprivations that people face in their daily lives. It includes factors like education, health, and living standards to capture the real extent of hardship. The 2025 Global MPI, released on October 17, 2025, marks a significant milestone by combining climate hazard data with poverty measures, highlighting how environmental risks and poverty are deeply connected across the world.

Multidimensional Poverty Index

The Multidimensional Poverty Index (MPI) is an international measure of poverty developed by the United Nations Development Programme (UNDP) and the Oxford Poverty and Human Development Initiative (OPHI). Unlike monetary poverty, which measures income alone, MPI identifies people who are deprived in multiple aspects of life such as education, health, and standard of living. 

Each of these three dimensions carries several specific indicators. A household is considered multidimensionally poor when it is deprived in at least one-third of the weighted indicators. The MPI value ranges from 0 to 1, where a lower value indicates better performance. It serves as a crucial policy tool for governments to monitor and address poverty more effectively.

Multidimensional Poverty Index 2025

The Global MPI Report 2025, titled “Overlapping Hardships: Poverty and Climate Hazards”, presents an in-depth look at how poverty and environmental vulnerability overlap. It evaluates data from 109 countries, with subnational estimates for 1,359 regions across 101 nations. Key Findings from MPI 2025 Report:

  1. 1.1 billion people out of 6.3 billion live in acute multidimensional poverty.
  2. More than 50% of the poor are children, highlighting generational vulnerability.
  3. Around 740 million poor people, approximately 64.5%, live in middle-income countries.
  4. 887 million poor individuals are exposed to at least one of four major climate hazards: high heat, drought, floods, and air pollution.
  5. Among these, 309 million face three or four concurrent hazards, intensifying their hardship.
  6. Common deprivations include lack of clean cooking fuel, housing, sanitation, nutrition, and electricity.
  7. India’s MPI value stands at 0.069, indicating significant progress compared to past years.

Multidimensional Poverty Index Indicators

The Multidimensional Poverty Index measures deprivation through three key dimensions, each containing specific indicators. Every indicator is assigned a particular weight, contributing to the overall MPI score.

Multidimensional Poverty Index Indicators

  1. Health (1/3 Total Weight)
    • Nutrition (1/6): A person is deprived if any adult or child in the household is undernourished.
    • Child Mortality (1/6): A family is deprived if any child under 18 has died in the past five years.
  1. Education (1/3 Total Weight)
    • Years of Schooling (1/6): Deprivation occurs if no household member above school entrance age + six years has completed six years of schooling.
    • School Attendance (1/6): A household is deprived if any school-aged child is not attending school up to class eight.
  1. Standard of Living (1/3 Total Weight)
    • Cooking Fuel (1/18): Using wood, charcoal, dung, or coal counts as deprivation.
    • Sanitation (1/18): Sanitation is considered deprived if facilities are unimproved or shared with other households.
    • Drinking Water (1/18): If improved water is unavailable or over a 30-minute round trip away, it is deprived.
    • Electricity (1/18): Absence of electricity is a deprivation.
    • Housing (1/18): If walls, roof, or floor are made from natural or rudimentary materials, it is deprived.
    • Assets (1/18): If the household owns fewer than one asset such as a radio, TV, or bicycle, and no vehicle, it is deprived.

Multidimensional Poverty Index Calculation

The Multidimensional Poverty Index is calculated using a systematic and data-driven process. It includes the following steps:

  1. Identification of Deprivations: Each household is assessed across the ten indicators.
  2. Scoring: Each indicator is given a specific weight, and households are assigned scores based on their deprivation status.
  3. Cut-off Point: If the cumulative deprivation score is 33% or more, the household is identified as multidimensionally poor.
  4. Headcount Ratio (H): This represents the proportion of people identified as poor.
  5. Intensity (A): It measures the average proportion of indicators in which poor people are deprived.
  6. MPI Value (H × A): The final MPI score is obtained by multiplying the Headcount Ratio and Intensity.

Multidimensional Poverty Index India 

India’s multidimensional poverty reduction has been a global success story. Between 2015-16 and 2019-21, around 135 million people escaped multidimensional poverty according to earlier MPI findings.

Multidimensional Poverty Index

The national MPI value of 0.069 reflects a headcount ratio of 16.4%, meaning that about 16 out of every 100 Indians experience multidimensional poverty. The intensity of deprivation stands at 42%, which is the average proportion of indicators in which poor people are deprived. Breakdown by major dimensions:

  • Health deprivation: 32.2%
  • Education deprivation: 28.2%
  • Standard of living: 39.7%

States like Bihar, Jharkhand, Uttar Pradesh, and Madhya Pradesh still have higher MPI values, showing deeper deprivations. In contrast, states such as Kerala, Tamil Nadu, and Goa perform far better, with very low poverty intensity and higher educational attainments.

Kerala to Announce Extreme Poverty Free Status

On November 1, 2025, Kerala will become the first Indian state officially declared free from extreme poverty. The Extreme Poverty Eradication Programme, launched in 2021, identified 64,006 extremely poor families through detailed surveys assessing deprivation in food, health, livelihood, and shelter. Following this, micro-plans were prepared for each family, ensuring access to essentials like housing, land, and documents. As of 2025, 59,277 families have been successfully uplifted. Kerala’s poverty rate, just 0.7% (NITI Aayog, 2021), is the lowest in India. The official declaration will be made by Chief Minister Pinarayi Vijayan in Thiruvananthapuram, marking a historic milestone.

Multidimensional Poverty Index Challenges

Despite global progress, multidimensional poverty remains a critical challenge. The intertwining of poverty and climate vulnerability is one of the biggest threats of the 21st century. The 2025 report highlights several ongoing challenges that demand urgent global attention.

  1. Climate and Environmental Risks: Nearly 887 million poor people live in regions facing at least one major climate hazard, and 309 million face multiple hazards. Droughts, floods, and extreme heat directly impact livelihoods, food security, and health, pushing millions back into poverty.
  2. Unequal Access to Resources: Inequality persists both within and between countries. Rural areas continue to lag behind in sanitation, drinking water, and energy access, showing that infrastructure development remains incomplete.
  3. Child Poverty: Children constitute more than half of the global multidimensionally poor population. Malnutrition, low school attendance, and poor living standards threaten their long-term development.
  4. Data Gaps and Measurement Challenges: Many low-income countries lack regular data collection, making it difficult to monitor poverty reduction accurately. Reliable and timely data are essential for effective policy interventions.
  5. Policy Fragmentation: Policies addressing poverty often operate in silos, missing the interconnected nature of deprivations. Integrating environmental and social policies is key to sustainable poverty alleviation.

Way Forward:

  1. Integrated Development Approach: Governments must combine poverty reduction with climate adaptation strategies.
  2. Focus on Education and Skill Development: Education remains a critical tool for breaking poverty cycles.
  3. Inclusive Growth Policies: Ensuring equitable access to healthcare, housing, and sanitation can accelerate progress.
  4. Community Participation: Local empowerment and decentralized planning can enhance efficiency in poverty eradication.
  5. Data-Driven Decision Making: Expanding data collection and sharing across regions will improve monitoring and accountability.
  6. International Cooperation: Richer nations and global institutions must provide financial and technical assistance to developing countries.

Multidimensional Poverty Index UPSC

The 2025 Global Multidimensional Poverty Index reminds the world that poverty is not just about income, it is about overlapping hardships that affect human dignity and opportunity. India’s progress, especially the success of states like Kerala, shows that strategic investment in health, education, and social protection can yield powerful results. However, the growing link between poverty and climate hazards calls for renewed global commitment to building a poverty-free and climate-resilient future.

This year’s report provides valuable insight into how climate change and poverty interact, stressing that countries facing the steepest temperature rises are often those already struggling with high poverty rates.

Multidimensional Poverty Index FAQs

Q1: What is the Multidimensional Poverty Index (MPI)?

Ans: The MPI measures poverty using multiple indicators beyond income, including health, education, and living standards, developed by UNDP and Oxford University.

Q2: What is India’s MPI value in 2025?

Ans: As per the 2025 Global MPI Report, India’s MPI value is 0.069, reflecting a steady improvement in multidimensional poverty reduction.

Q3: How many people live in multidimensional poverty globally in 2025?

Ans: According to the UNDP Global MPI 2025, around 1.1 billion people across 109 countries live in acute multidimensional poverty.

Q4: Which states in India have the lowest multidimensional poverty?

Ans: Kerala, Tamil Nadu, and Himachal Pradesh have the lowest multidimensional poverty levels, due to better education, health, and infrastructure outcomes.

Q5: How is the MPI different from income-based poverty?

Ans: Unlike income measures, the MPI considers ten indicators across three dimensions, health, education, and standard of living, to capture holistic poverty levels.

UPSC Result 2026 Declared at upsc.gov.in, Download PDF Link

UPSC Result 2026 Declared

UPSC Result 2026 has been officially released by the Union Public Service Commission on its official website at upsc.gov.in. Candidates who appeared for the Civil Services Examination (CSE) 2025 can now check their results online in PDF format. The result includes the roll numbers and names of candidates selected in the final list.

UPSC Result 2026 Out

The UPSC Result 2026 has been officially released on 6th March 2026 by the Union Public Service Commission on its official website, upsc.gov.in. Candidates who appeared for the Civil Services Examination 2026 can now check their qualifying status in the result PDF available online. 

UPSC CSE Result 2026 Overview

The UPSC CSE Result 2026 is officially declared by the Union Public Service Commission on the official portal. It determines the selection of candidates for prestigious services like IAS, IPS, IFS, and other Group A & B central services. UPSC has also released UPSC Marksheet 2025 PDF which includes mains and interview marks of all the candidates selection in the UPSC.

UPSC CSE Result 2026 Overview
Particulars Details

Exam Name

Civil Services Examination (CSE) 2026

Conducting Authority

Union Public Service Commission (UPSC)

Exam Level

National

Exam Stages

Prelims, Mains, Interview (Personality Test)

Mode of Result

Online (PDF Format)

Services Offered

IAS, IPS, IFS, IRS, and other Central Services

UPSC Result 2026 Date

March 6, 2026

Final Merit Basis

Mains Written Marks + Interview Marks

Total Marks (Final Merit)

2025 Marks (1750 Mains + 275 Interview)

Selection Process

Written Examination + Personality Test

Training Academies

LBSNAA (IAS), SVPNPA (IPS), and other service academies

Result Availability

Official website – upsc.gov.in

UPSC Result 2026 Download PDF

The UPSC Result 2026 PDF is released on March 6, 2026, on the official UPSC website and contains the list of qualified candidates for various stages of the Civil Services Examination. This downloadable PDF includes roll numbers of candidates who have cleared interview, which is the final stage of the selection process.

UPSC Result 2026 Download PDF

Steps to Download UPSC Result 2026 PDF

The UPSC Result 2026 PDF can be easily downloaded from the official website of the Union Public Service Commission. Candidates must carefully follow the official steps to access the result and verify their roll number or name in the list.

  1. Visit the Official Website: Open your browser and go to upsc.gov.in.
  2. Go to the Examination Section: On the homepage, click on the “Examination” tab available in the top menu.
  3. Click on Active Examinations: From the dropdown menu, select “Active Examinations” to view the latest updates.
  4. Find the Result Link: Look for the link titled “Civil Services Examination, 2026 – Result” (Prelims/Mains/Final).
  5. Open the PDF File: Click on the result link; the PDF will open in a new tab.
  6. Search Your Roll Number: Press Ctrl + F (or use the search option on mobile) and enter your Roll Number.
  7. Verify Your Details: If your roll number appears in the list, you have qualified for the next stage or final selection.
  8. Download the PDF: Click on the download icon to save the result file to your device.
  9. Take a Printout: Keep a printed copy for future reference, especially for DAF submission and interview rounds.
  10. Check Official Notices: Also review any additional instructions mentioned along with the result notification.

UPSC Toppers List 2025

The UPSC Toppers List 2025 has been published along with the final result by the Union Public Service Commission. Candidates who appeared in the Civil Services Examination 2025 will be able to check the toppers’ names, All India Rank (AIR), roll numbers, and marks.

Rank Roll Number Name Total Marks
1 1131589 Anuj Agnihotri 1071
2 4000040 Rajeshwari Suve M 1067
3 3512521 Akansh Dhull 1057
4 0834732 Raghav Jhunjhunwala 1042
5 0409847 Ishan Bhatnagar 1038
6 6410067 Zinnia Aurora 1037
7 0818306 A R Rajah Mohaideen 1035
8 0843487 Pakshal Secretry 1035
9 0831647 Astha Jain 1033
10 1523945 Ujjwal Priyank 1033
11 1512091 Yashaswi Raj Vardhan 1032
12 0840280 Akshit Bhardwaj 1031
13 7813999 Ananya Sharma 1028
14 5402316 Surabhi Yadav 1027
15 3507500 Simrandeep Kaur 1026
16 0867445 Monika Srivastava 1025
17 0829589 Chitwan Jain 1025
18 5604518 Sruthi R B 1025
19 0105602 Nisar Dishant Amrutlal 1024
20 6630448 Ravi Raaz 1024

UPSC Cut Off 2025

The UPSC Cut Off 2025 has been released by the Union Public Service Commission as the final result has already been declared. The cut-off marks are published category-wise and stage-wise on the official website after the completion of the entire selection process. Candidates will be able to check the Prelims, Mains, and Final cut-off marks in PDF format. Below is a previous year cut off.

Category 2025 2024 2023 2022 2021 2020
General 963 947 953 960 953 944
EWS 926 917 923 926 916 894
OBC 931 910 919 923 910 907
SC 905 880 890 893 886 875
ST 902 884 891 900 883 876
PwBD-1 917 876 894 879 892 867
PwBD-2 944 913 930 913 932 910
PwBD-3 804 701 756 632 689 675
PwBD-5 631 461 589 590 701 465


[youtube url="https://www.youtube.com/watch?v=jt7VPv1sj2Q" width="560" height="315"]

What is After UPSC Final Result 2026?

After the declaration of the UPSC Final Result 2026 by the Union Public Service Commission, selected candidates officially enter the final phase of the Civil Services selection process. The final merit list is prepared based on marks obtained in the Mains Examination and the Personality Test. This stage marks the transition from aspirant to future civil servant, followed by service allocation and training.

Publication of Final Merit List

  • UPSC releases a merit list containing names, roll numbers, and All India Ranks (AIR).
  • Marks of recommended and non-recommended candidates are also published later.
  • The merit list determines service allocation priority.

Service Allocation Process

  • Services such as IAS, IPS, IFS, IRS, and other Group A & B services are allotted.
  • Allocation depends on rank, category, medical status, and service preference filled in DAF.
  • Higher rank generally increases the chances of getting top preferred services.

Cadre Allocation (For IAS/IPS/IFS)

  • Selected candidates are allotted state cadres or joint cadres.
  • Cadre allocation follows the official cadre policy and reservation norms.
  • Once allotted, officers usually serve most of their career in that cadre.

Medical Examination

  • Candidates must undergo a detailed medical test at designated government hospitals.
  • Medical fitness is essential, especially for services like IPS and IFS.
  • Unfit candidates may be considered for alternative services if eligible.

Document Verification

  • Original certificates (educational, category, age, etc.) are verified.
  • Any discrepancy can lead to cancellation of candidature.
  • Candidates must ensure all documents match the details submitted earlier.

Foundation Course Training

  • Selected candidates join the Foundation Course before service-specific training.
  • IAS officers train at Lal Bahadur Shastri National Academy of Administration.
  • IPS officers undergo training at Sardar Vallabhbhai Patel National Police Academy.

Probation Period

  • Officers remain on probation for a specified period.
  • They receive practical field training and departmental exposure.
  • Performance during probation impacts confirmation in service.

First Posting

  • After training completion, officers receive their first official posting.
  • IAS officers are usually appointed as Sub-Divisional Magistrates (SDM) or equivalent roles.
  • IPS officers begin as Assistant Superintendent of Police (ASP).

UPSC Result 2026 FAQs

Q1: When will the UPSC Result 2026 be declared?

Ans: The UPSC Result 2026 has been declared on 6th March 2026, as per the official notification.

Q2: How can I check my UPSC Result 2026?

Ans: You can visit upsc.gov.in, download the result PDF, and search your Roll Number or Name using the Ctrl + F option.

Q3: Is the UPSC Result released name-wise?

Ans: Yes, the final result is released name-wise along with the All India Rank (AIR) of recommended candidates.

Q4: What details are mentioned in the UPSC Result 2026 PDF?

Ans: The result PDF includes Roll Numbers, Candidate Names (final list), and Rank details for selected candidates.

Q5: What happens after the UPSC Final Result 2026?

Ans: After the final result, candidates undergo service allocation, medical examination, document verification, and training at their respective academies.

List of Wars Between India and Pakistan, Year, Cause, Outcome

List of Wars Between India and Pakistan

The partition of British India in 1947 gave birth to two nations, India and Pakistan. The division, grounded in religious and political differences, led to widespread violence, displacement, and a bitter legacy. Since independence, India and Pakistan have fought four major wars, engaged in numerous military standoffs, and have experienced countless border conflicts and terrorist attacks. The article below includes the List of Wars Between India and Pakistan from the First Kashmir War of 1947 to the recent Operation Sindoor of 2025 including key facts, triggers, outcomes, and their broader implications.

List of Wars Between India and Pakistan

Since 1947, India and Pakistan have experienced several military confrontations, most of them rooted in the long-standing Kashmir dispute and cross-border tensions. These clashes have ranged from full-scale wars to limited strikes and standoffs, each with its own background, trigger, and outcome. The table below offers a List of Wars Between India and Pakistan over the years.

List of Wars Between India and Pakistan
Conflict / War Year Cause / Trigger Outcome

First Kashmir War

1947-1948

Accession of J&K, tribal invasion

LoC established, Kashmir dispute unresolved

Second Indo-Pak War

1965

Pakistan’s Operation Gibraltar

Tashkent Agreement, status quo restored

Indo-Pak War / Bangladesh

1971

Bengali independence movement

Creation of Bangladesh

Kargil War

1999

Pakistani intrusion in Kargil

Indian victory, global condemnation of Pak

Siachen Conflict

1984-2003

Control of Siachen Glacier

India holds key positions

Military Standoff

2001-2002

Indian Parliament attack

De-escalated via diplomacy

Surgical Strikes

2016

Uri attack

Terror camps destroyed

Balakot Airstrike

2019

Pulwama attack

First IAF strike on Pak territory since 1971

Operation Sindoor

2025

Pahalgam terror attack

Massive punitive retaliation, ceasefire

Major Wars Between India and Pakistan

First Indo-Pak War (1947–1948): First Kashmir War

  • Duration: October 22, 1947 – January 1, 1949
  • Cause: Accession of Jammu & Kashmir
  • Outcome: Ceasefire brokered by UN, establishment of the Line of Control (LoC)

Background:
Following independence, princely states were given three choices: accede to India, join Pakistan, or remain independent. Maharaja Hari Singh, the ruler of Jammu and Kashmir, initially chose to remain independent. However, when Pakistani tribal militias invaded in October 1947, he sought help from India and signed the Instrument of Accession, making Jammu & Kashmir a part of India.

Course of War:
The Indian Army was airlifted into Srinagar and successfully pushed back the infiltrators. Key battles were fought in Uri, Baramulla, and Jammu. However, Pakistan retained control over a portion of the territory now known as Pakistan-occupied Kashmir (PoK).

Result:
A UN-mediated ceasefire came into effect on January 1, 1949. It led to the establishment of the LoC, dividing Jammu and Kashmir between the two nations. The Kashmir issue, however, remained unresolved and a perpetual flashpoint.

Second Indo-Pak War (1965)

  • Duration: August-September 1965
  • Cause: Dispute over Kashmir, Pakistani Operation Gibraltar
  • Outcome: Tashkent Agreement (January 1966) - Status quo ante bellum

Background:
Pakistan initiated Operation Gibraltar, sending soldiers disguised as locals into Jammu and Kashmir to incite rebellion. The plan backfired as locals did not support the intruders, and the Indian Army responded with full-scale retaliation.

Course of War:
The conflict spread across the International Border. Major battles were fought in Lahore, Sialkot, and the Rann of Kutch. The Indian Army made significant gains, and both sides suffered heavy casualties.

Result:
After intense fighting lasting 17 days, a UN-mandated ceasefire was declared. The Tashkent Agreement, brokered by the USSR, restored pre-war positions. However, the war did not resolve the Kashmir dispute, and both nations claimed victory.

Indo-Pak War of 1971: Bangladesh Liberation War

  • Duration: December 3-16, 1971
  • Cause: Political crisis in East Pakistan; support for Bengali independence movement
  • Outcome: Creation of Bangladesh, Decisive Indian victory

Background:
East Pakistan (present-day Bangladesh) had been agitating for autonomy. Following the denial of electoral victory to Sheikh Mujibur Rahman’s Awami League and subsequent military crackdown by West Pakistan, a refugee crisis emerged with over 10 million people fleeing to India.

Course of War:
India supported the Mukhti Bahini (freedom fighters) and launched military operations on both the eastern and western fronts. The Battle of Longewala in Rajasthan and naval blockade of Karachi were strategic successes.

Result:
On December 16, 1971, Pakistan’s Eastern Command surrendered in Dhaka with over 90,000 troops taken as prisoners of war. The war led to the birth of Bangladesh. The Shimla Agreement (1972) was signed, where India returned captured territory in the west in exchange for peace commitments from Pakistan.

Kargil War (1999)

  • Duration: May-July 1999
  • Cause: Pakistani infiltration into Kargil sector
  • Outcome: India regained all lost territory, diplomatic victory

Background:
Pakistani troops and militants infiltrated into Indian positions along the LoC in the Kargil region. Their aim was to cut off National Highway 1A, thereby disrupting Indian logistics in Siachen and Kashmir.

Course of War:
India launched Operation Vijay, combining infantry assaults, artillery bombardments, and air strikes. Major battles took place at Tololing, Tiger Hill, and Batalik.

Result:
Indian forces successfully recaptured all the occupied positions. International pressure, especially from the United States, forced Pakistan to withdraw. The war exposed Pakistan Army's duplicity, as then-Prime Minister Nawaz Sharif was kept unaware of the operation by the military leadership.

Other Major Conflicts and Military Engagements

India and Pakistan have experienced a series of high-stakes military confrontations since their independence in 1947, with several conflicts emerging even in the post-Kargil era. While full-scale wars have been largely avoided since 1999, tensions have remained high due to terrorism, border conflicts, and strategic rivalries. The table below summarizes key India-Pakistan military engagements and operations from 1984 onwards, highlighting their causes, actions taken by India, and their outcomes.

Other Major Conflicts and Military Engagements
Event Period/Date Trigger/Cause Action Taken Outcome

Siachen Conflict

1984-2003

Strategic control over Siachen Glacier

India launched Operation Meghdoot

India gained and maintained control over key heights on the glacier

2001-2002 Military Standoff

Dec 2001 - Oct 2002

Indian Parliament attack (Dec 13, 2001)

India initiated Operation Parakram (massive troop mobilization)

Full-scale war was averted; high tension persisted for months

Surgical Strikes

Sept 29, 2016

Uri attack (19 Indian soldiers killed by Pakistani terrorists)

Cross-LoC surgical strikes on terror launch pads

Marked a proactive shift in India’s counter-terror strategy; received wide domestic support

Balakot Airstrikes

Feb 26, 2019

Pulwama attack (40 CRPF personnel martyred)

IAF conducted airstrikes on terror camps in Balakot, Pakistan

Escalated into air combat; Wing Commander Abhinandan captured and returned by Pakistan

Operation Sindoor (2025)

Operation Sindoor 2025 was launched in direct response to the tragic Pahalgam terror attack on April 22, 2025, which claimed the lives of 26 innocent civilians. India initiated a swift and coordinated military offensive on May 7, 2025. The operation spanned approximately four days and concluded on May 10, 2025. The primary objectives of this mission were to dismantle terror infrastructure across the border, and deliver a strong message of deterrence to hostile elements.

Operation Sindoor (2025)
Phase Details

Phase 1: Precision Strikes

Targets: Terrorist camps of LeT, JeM, Hizbul in PoJK and across Pakistan Weapons Used: SCALP missiles, BrahMos, HAMMER bombs, loitering munitions Notable Platforms: Rafale, Su-30 MKI, drones

Phase 2: Pakistani Retaliation

Pakistan launched drones and missiles at Indian military bases India’s air defense systems intercepted many threats India responded with deep strikes targeting airbases and radars inside Pakistan

Phase 3: Escalation & Ceasefire

India struck major Pakistani airbases like Sargodha, Rahim Yar Khan, Bholari Destruction of 6+ fighter jets, 2 surveillance aircraft, 10+ drones, and missile systems Pakistan requested a ceasefire within 88 hours

List of Wars Between India and Pakistan FAQs

Q1: How many wars have India and Pakistan fought since independence?

Ans: India and Pakistan have fought four major wars in 1947, 1965, 1971, and 1999 along with several military standoffs and counter-terror operations.

Q2: What was the main reason for the First Indo-Pak War in 1947–48?

Ans: The first war was triggered by Pakistan-backed tribal invasion in Jammu and Kashmir after the Maharaja signed the Instrument of Accession to join India.

Q3: What was the outcome of the 1971 Indo-Pak War?

Ans: The 1971 war led to the creation of Bangladesh, with India securing a decisive victory and capturing over 90,000 Pakistani soldiers.

Q4: What was the significance of the Kargil War in 1999?

Ans: The Kargil War was fought in high-altitude terrain where India successfully pushed back infiltrators and reclaimed lost territory. It was seen as a diplomatic and military win for India.

Q5: What is the Line of Control (LoC)?

Ans: The LoC is the de facto border between India and Pakistan in the region of Jammu and Kashmir, established after the 1948 ceasefire.

Enquire Now